one raspberry pi with Debian 11 and EMQX 5.0.10 ( 10.50.122.20 )
one PC with Ubuntu 22.10 and EMQX 5.0.10 ( 10.50.122.41 )
two raspberry pi with mqtt clients to exchange messages between them
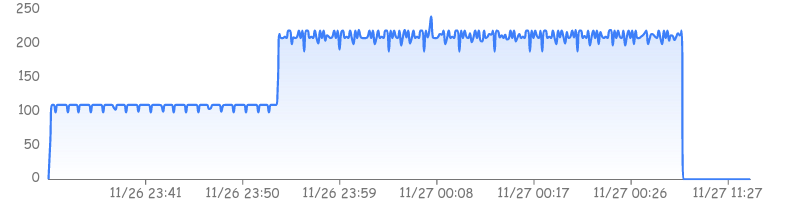
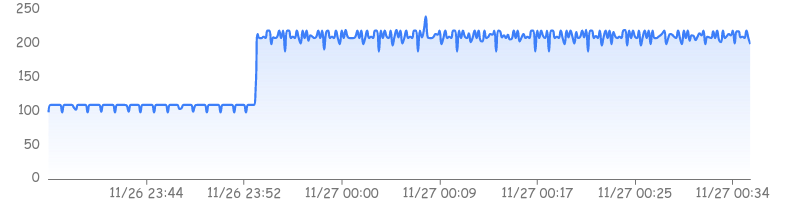
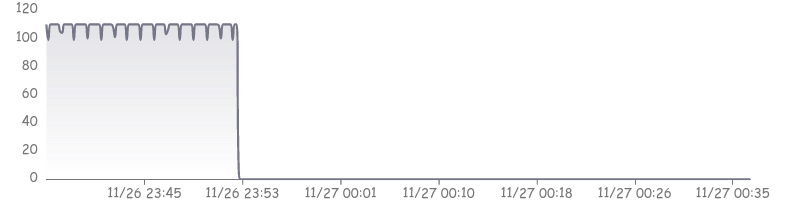
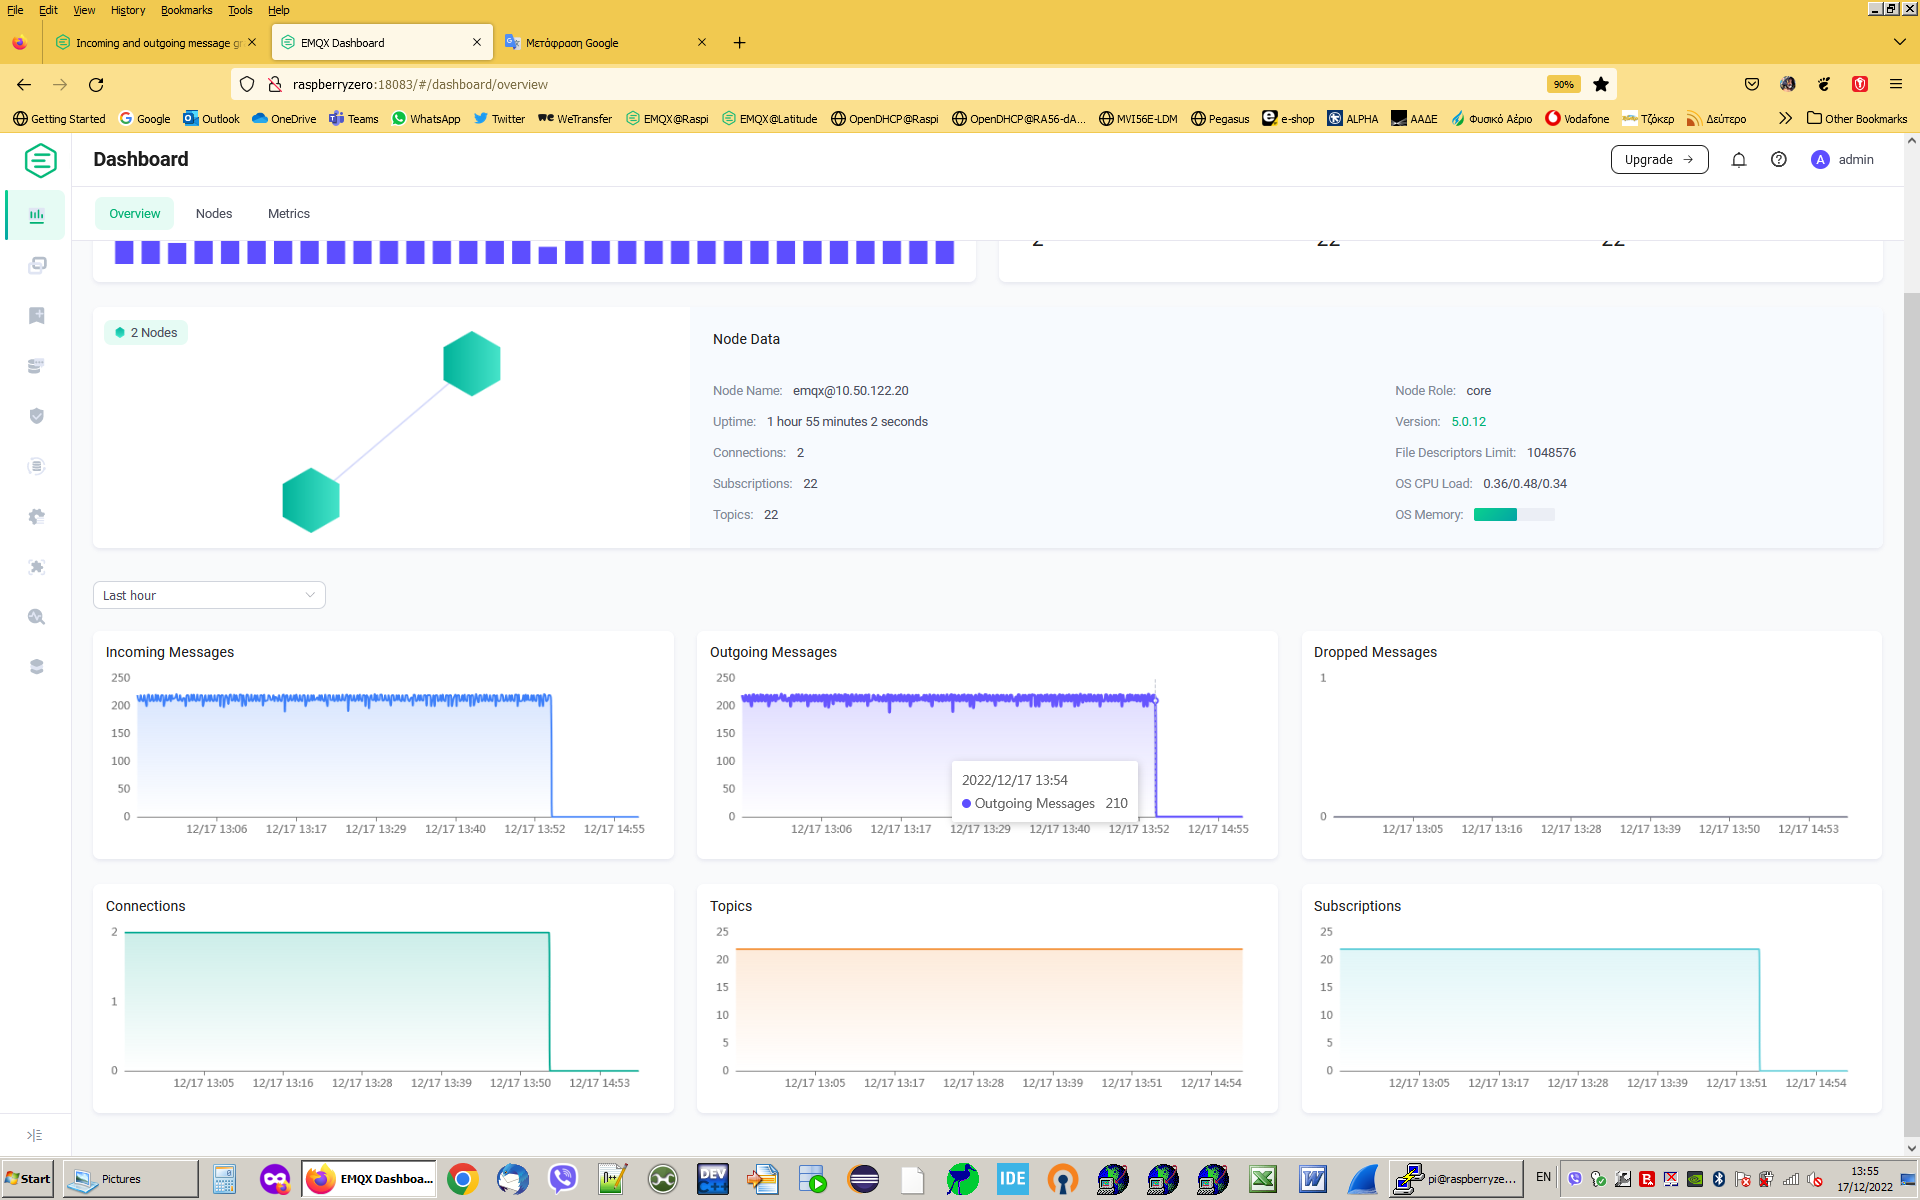
After executing the command sudo emqx ctl cluster join emqx@10.50.122.20 on the PC, the Incoming Messages and Outgoing Messages graphs are zeroed out. Αlso the Connections and Subscriptions graphs
After executing the command sudo emqx ctl cluster leave on the PC, the graphs return to normal
No Dropped Messages are recorded
Images
During a clustering (sudo emqx ctl cluster join emqx@10.50.122.20)
Hi. Sorry to keep you waiting, I have fed your issue back to our R&D colleagues, and they will finish the business at hand and provide you with support as soon as possible.
Do I understand correctly that the screenshots of the graphs shown in the ticket are taken from EMQX dashboard web UI?
If so, from which node, 10.50.122.20 or 10.50.122.41? Did you try to refresh the webpage after joining the nodes into a cluster?
How many nodes were shown in the cluster overview in the dashboard while the nodes were clustered?
When a node joins a cluster it drops all the data it had previously and replaces it with the data replicated from the original cluster it joins. This includes login sessions.
So far it looks like after you’ve joined the nodes into cluster your login cookie got invalidated, and the frontend could not request the metrics and replaced them with zeros.
The problem was solved after installing emqx version 5.0.12.
I notice a small problem,
in that the graph ends an hour later than the real time,
as long as the connection to the cluster lasts (14:50’ instead of 13:50’ for example)