Alarm
EMQX offers a built-in monitoring and alarm functionality for monitoring the internal state changes, such as CPU occupancy, system and process memory occupancy, number of processes, rule engine resource status, and cluster partition and healing. EMQX triggers and records these changes when they exceed a threshold or deviate from expectations, and removes them from the list once they are restored.
This page introduces which alarm information EMQX provides, how you can obtain and check the detailed alarm information, and how to configure the alarm settings and thresholds in EMQX. The monitoring and alarm function keeps you notified of potential problems during operation. By configuring alarms and setting appropriate thresholds, you can make sure that EMQX remains secure, stable, and reliable.
Alarm List
The following table lists the alarms that can be triggered to indicate potential problems during system monitoring.
TIP
Depending on the severance and impacts on the system, alarms can have 3 levels:
Error: Errors caused by user presets. The client can perceive the error and retry.
Warning: Occasional errors, and need to be taken seriously if they occur frequently.
Critical: Irreversible data loss between the client and server, causing communication and business interruption.
The levels are defined from development perspectives and are only for a recommendation. You can define your own alarm levels according to the business needs.
| Alarm | Level | Description | Details | Threshold |
|---|---|---|---|---|
| high_system_memory_usage | Warning | System memory usage is too high | "System memory usage is higher than ~p%" | os_mon.sysmem_high_watermark = 70% |
| high_process_memory_usage | Warning | Single Erlang process memory usage is too high (percentage of system memory usage) | Process memory usage is higher than ~p% | os_mon.procmem_high_watermark = 5% |
| high_cpu_usage | Warning | CPU usage is too high | ~p% cpu usage | os_mon.cpu_high_watermark = 80% os_mon.cpu_low_watermark = 60% |
| too_many_processes | Warning | Too many processes | ~p% process usage | vm_mon.process_high_watermark = 80% vm_mon.process_low_watermark = 60% |
| partition | Critical | Partition occurs at node | Partition occurs at node ~s | - |
| resource | Critical | Resource is disconnected | Resource ~s(~s) is down | - |
| conn_congestion | Critical | Connection process congestion | connection congested | - |
Get Alarms
EMQX provides you with various ways to get alarms and check detailed alarm information. One way is to view the alarms on EMQX Dashboard, where you can view a list of active or historical alarms. However, it is only a central place for easy access to an overview of alarms that have been triggered. Another way is to subscribe to system topics through MQTT to receive real-time notifications of alarms with detailed alarm information. Alarms can also be accessed from the log or via REST API.
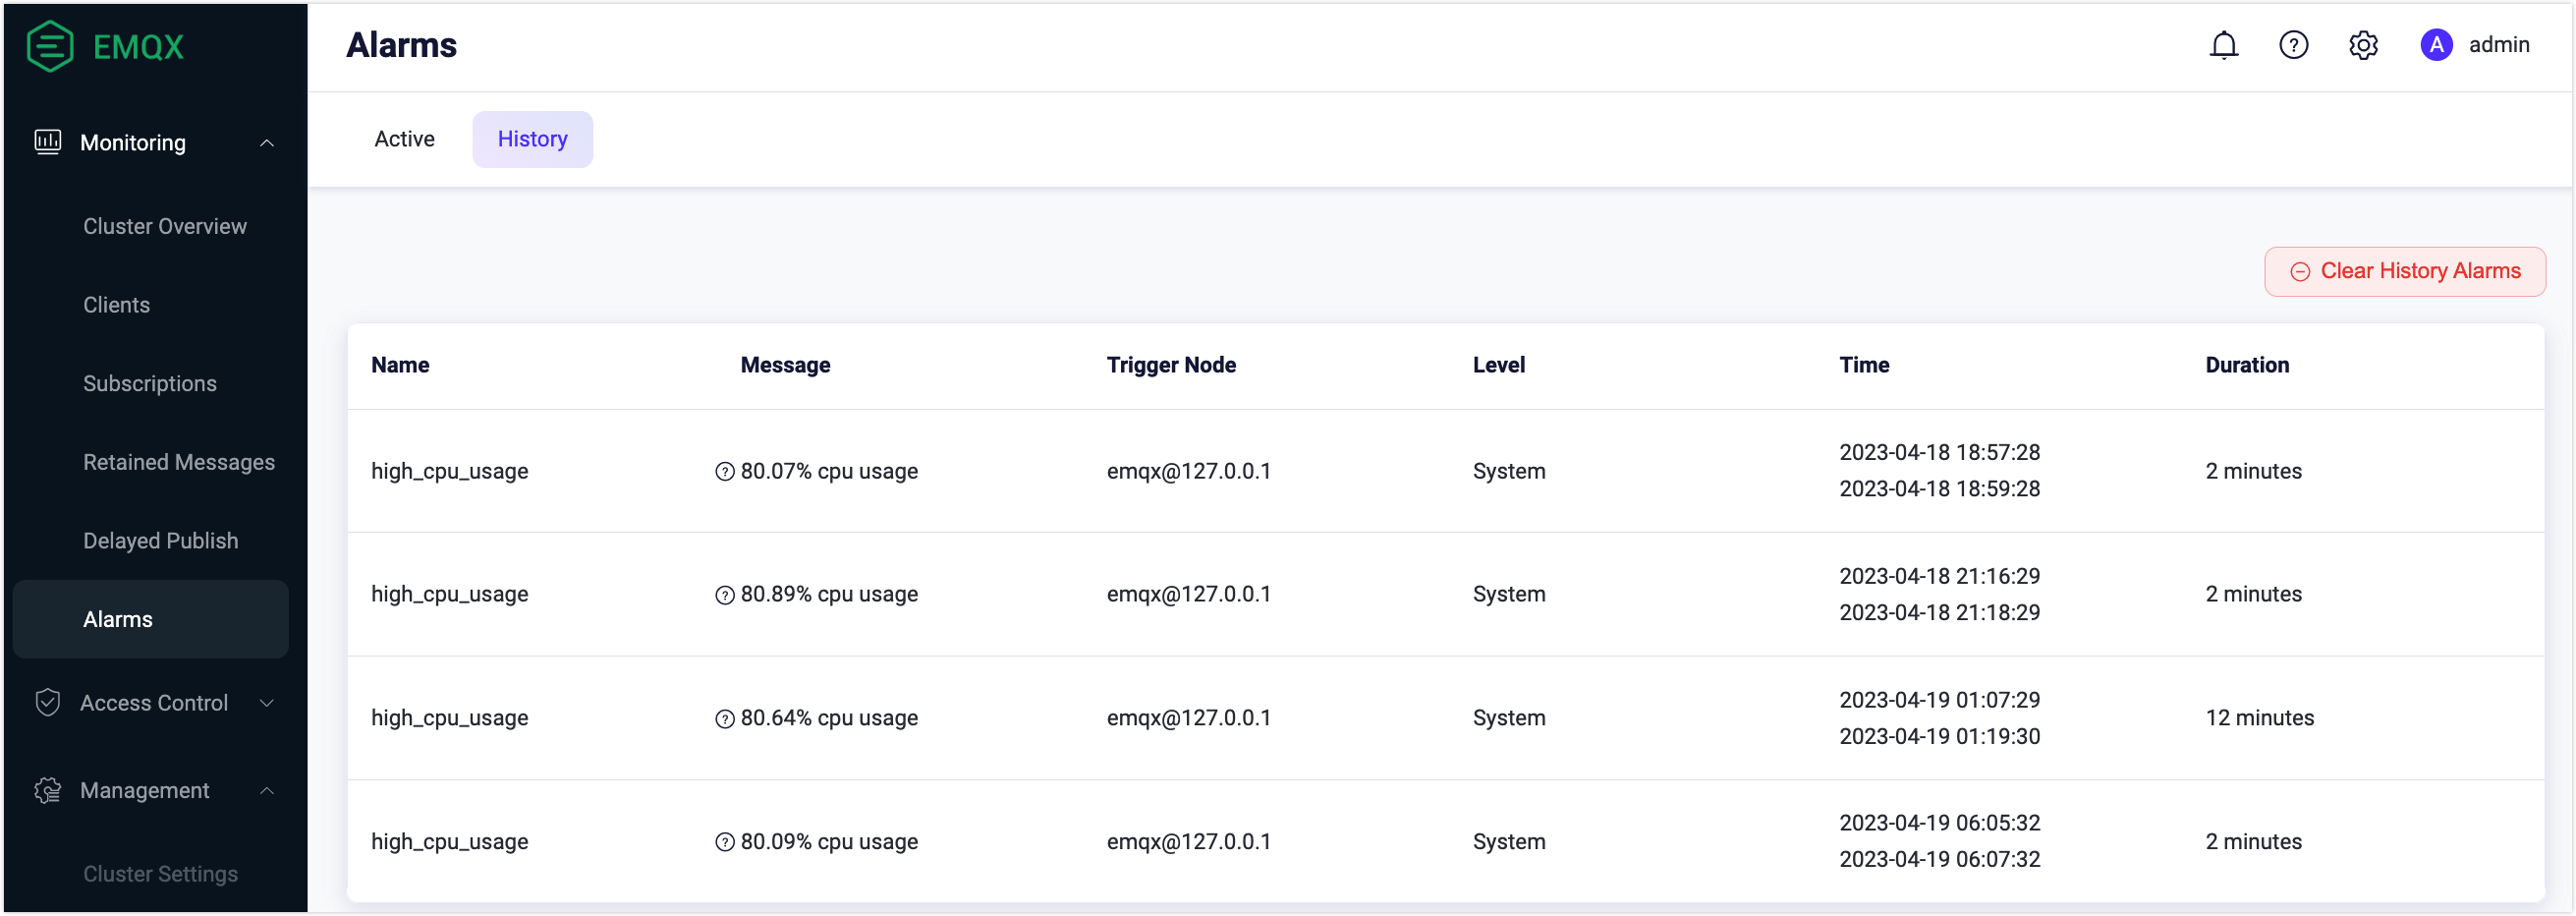
View Alarms on Dashboard
On EMQX Dashboard, click Monitoring -> Alarms. Select the Active or History tab, and you can see the list of currently active alarms and historical alarms.
Get Alarms via System Topic
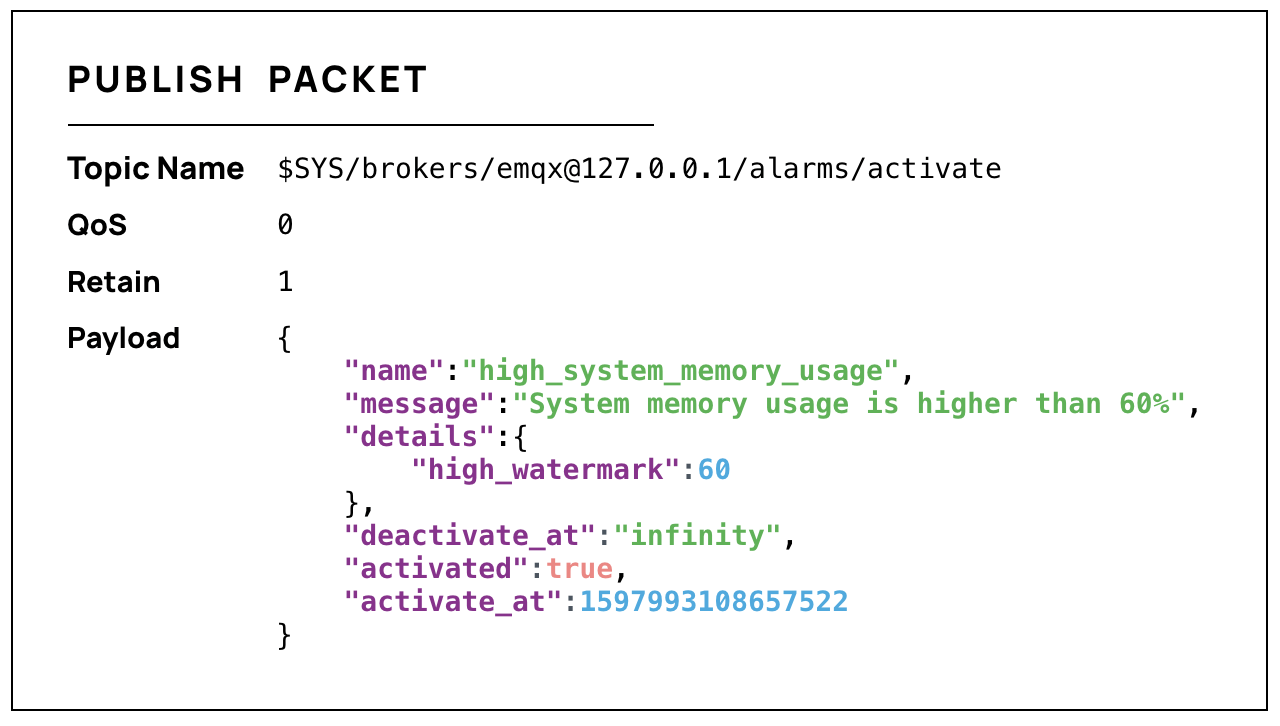
EMQX will publish an MQTT message to system topics $SYS/brokers/<Node>/alarms/activate or $SYS/brokers/<Node>/alarms/deactivate when an alarm is triggered or cleared. Users can subscribe to the topic to receive alarm notifications.
The payload in the alarm notification message is in JSON format and contains the following fields:
| Field | Type | Description |
|---|---|---|
name | string | Alarm name |
details | object | Alarm details |
message | string | Human-readable alarm instructions |
activate_at | integer | A UNIX timestamp in microseconds representing the activation time of the alarm |
deactivate_at | integer / string | A UNIX timestamp in microseconds representing the deactivation time of the alarm. The value of this field for the activated alarm is infinity. |
activated | boolean | Whether the alarm is activated |
Taking the alarm of high system memory usage as an example, you will receive an alarm message like below:
One system multifunction will be repeatedly reported. That is, if one alarm on high CPU usage is activated, the system will not generate another alarm of the same type. The generated alarm will be automatically deactivated when the monitored metric returns to normal, or you can manually deactivate the alarm.
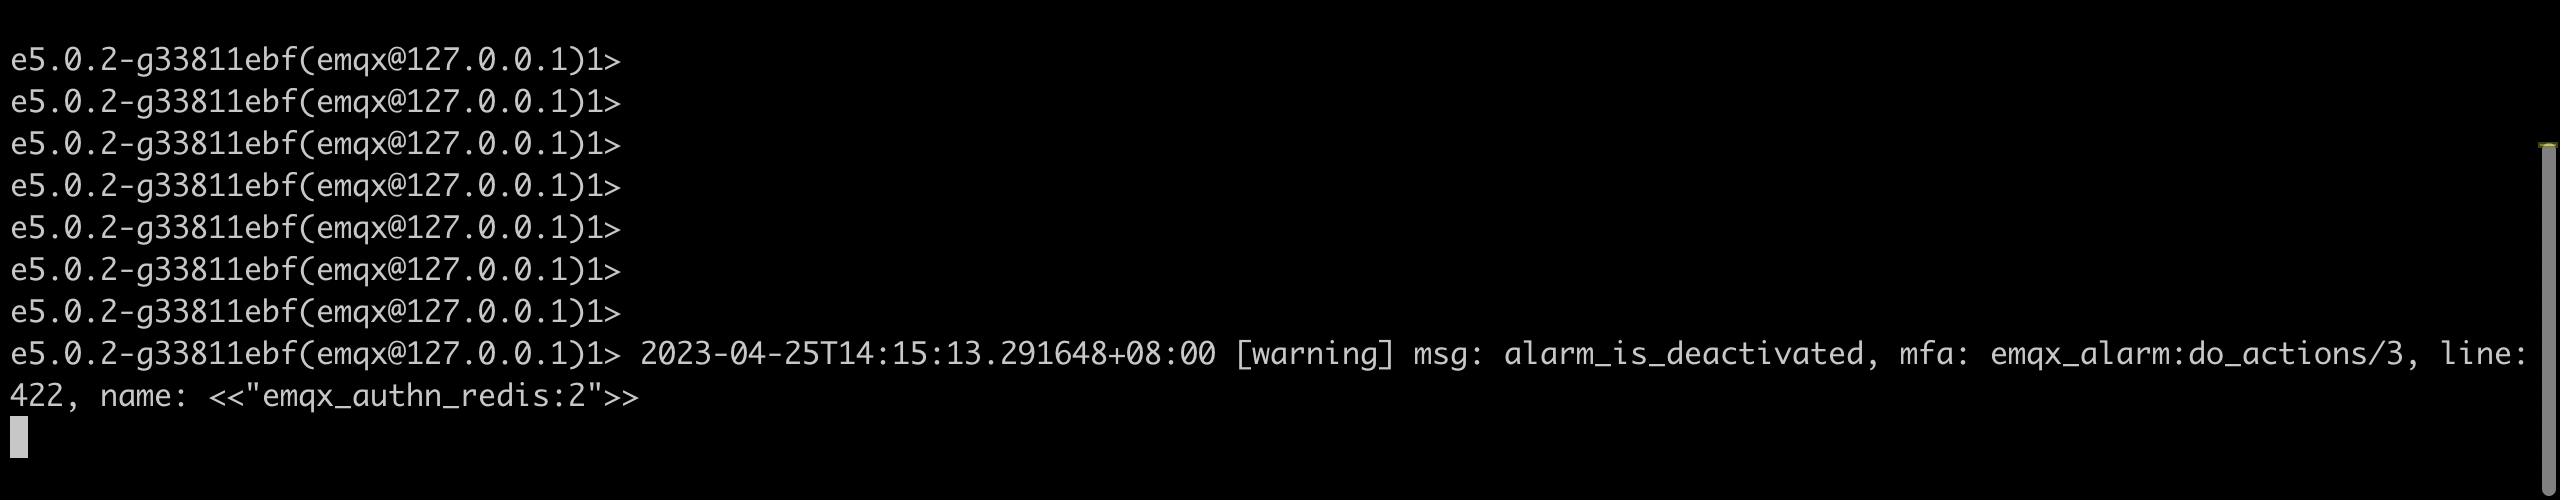
Get Alarms from Log
The activation and deactivation of alarms can be written to log (console or file). When failures occur during message transmission or event processing, detailed information can be logged, and the logging system can also be used to capture alerts through log analysis. The following example shows the detailed alarm information printed in the log: The log level is warning, and the msg field is alarm_is_activated and alarm_is_deactivated.
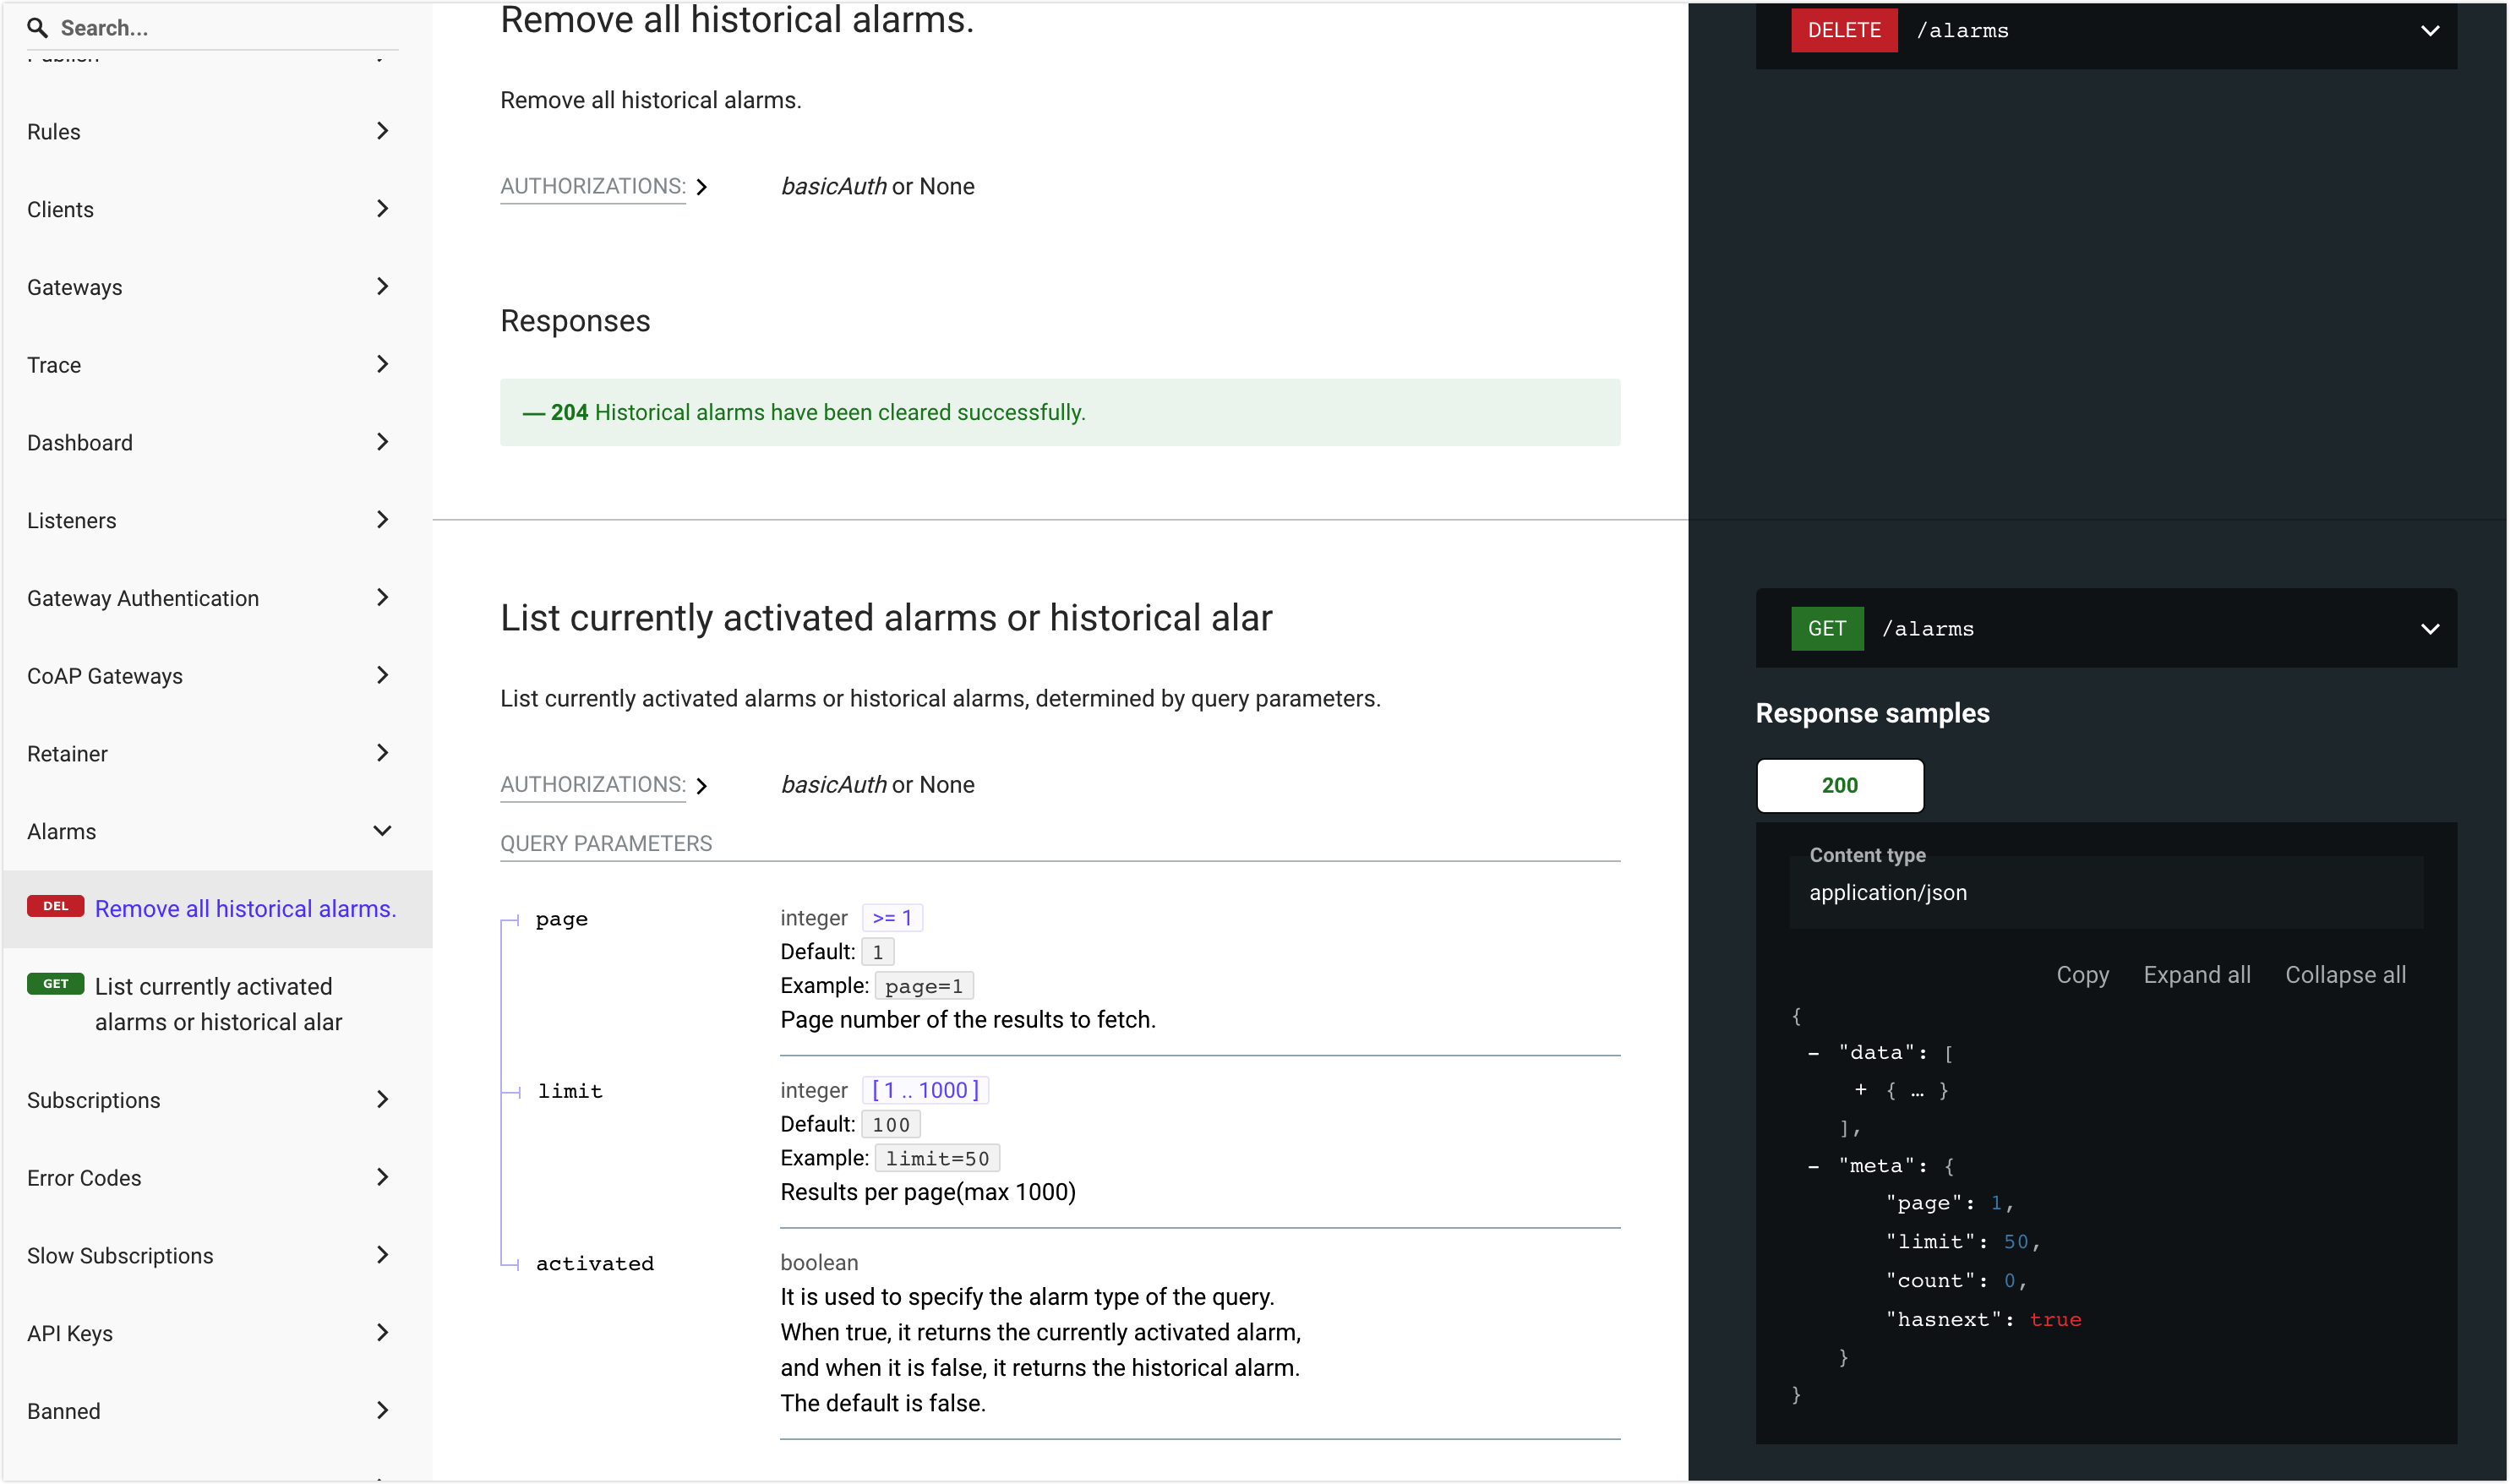
Get Alarms via REST API
You can query and manage alarms through the API. Click Alarms on the left navigation menu on the UI to execute this API request. For how to work with EMQX API, see REST API.
Alarm Configuration
Alarm configuration includes configuring alarm settings and thresholds. Alarm settings determine how the alarm message is displayed and stored, while alarm thresholds establish limits or values that trigger the alarm when potential problems are detected. The alarm configuration feature allows you to customize the alarm settings and thresholds to meet your business needs.
Configure Alarm Settings
The settings for alarms can only be configured by modifying the configuration items in emqx.conf file. The following table lists the configuration items available for alarm setting configuration.
| Configuration Item | Description | Default Value | Optional Values |
|---|---|---|---|
| alarm.actions | Actions of writing the alarm to log (console or file) and publishing the alarm as an MQTT message to the system topics $SYS/brokers/<node_name>/alarms/activate and $SYS/brokers/<node_name>/alarms/deactivate. The actions are triggered when the alarm is activated or deactivated. | ["log", "publish"] | - |
| alarm.size_limit | The maximum total number of deactivated alarms to be kept as history. When this limit is exceeded, the oldest deactivated alarms are deleted. | 1000 | 1-3000 |
| alarm.validity_period | Retention time of deactivated alarms. Alarms are not deleted immediately when deactivated but after a period of time. | 24h | - |
Configure Alarm Thresholds via Dashboard
Alarm thresholds can be configured on EMQX Dashboard. There are two ways to launch the Monitoring page for configuring the alarm thresholds:
- On the Alarms page, click the Setting button and you will be led to the Monitoring page.
- From the left navigation menu, click Management -> Monitoring.
On the Monitoring page, click the Erlang tab, you can configure the following items for the system performance of the Erlang Virtual Machine:
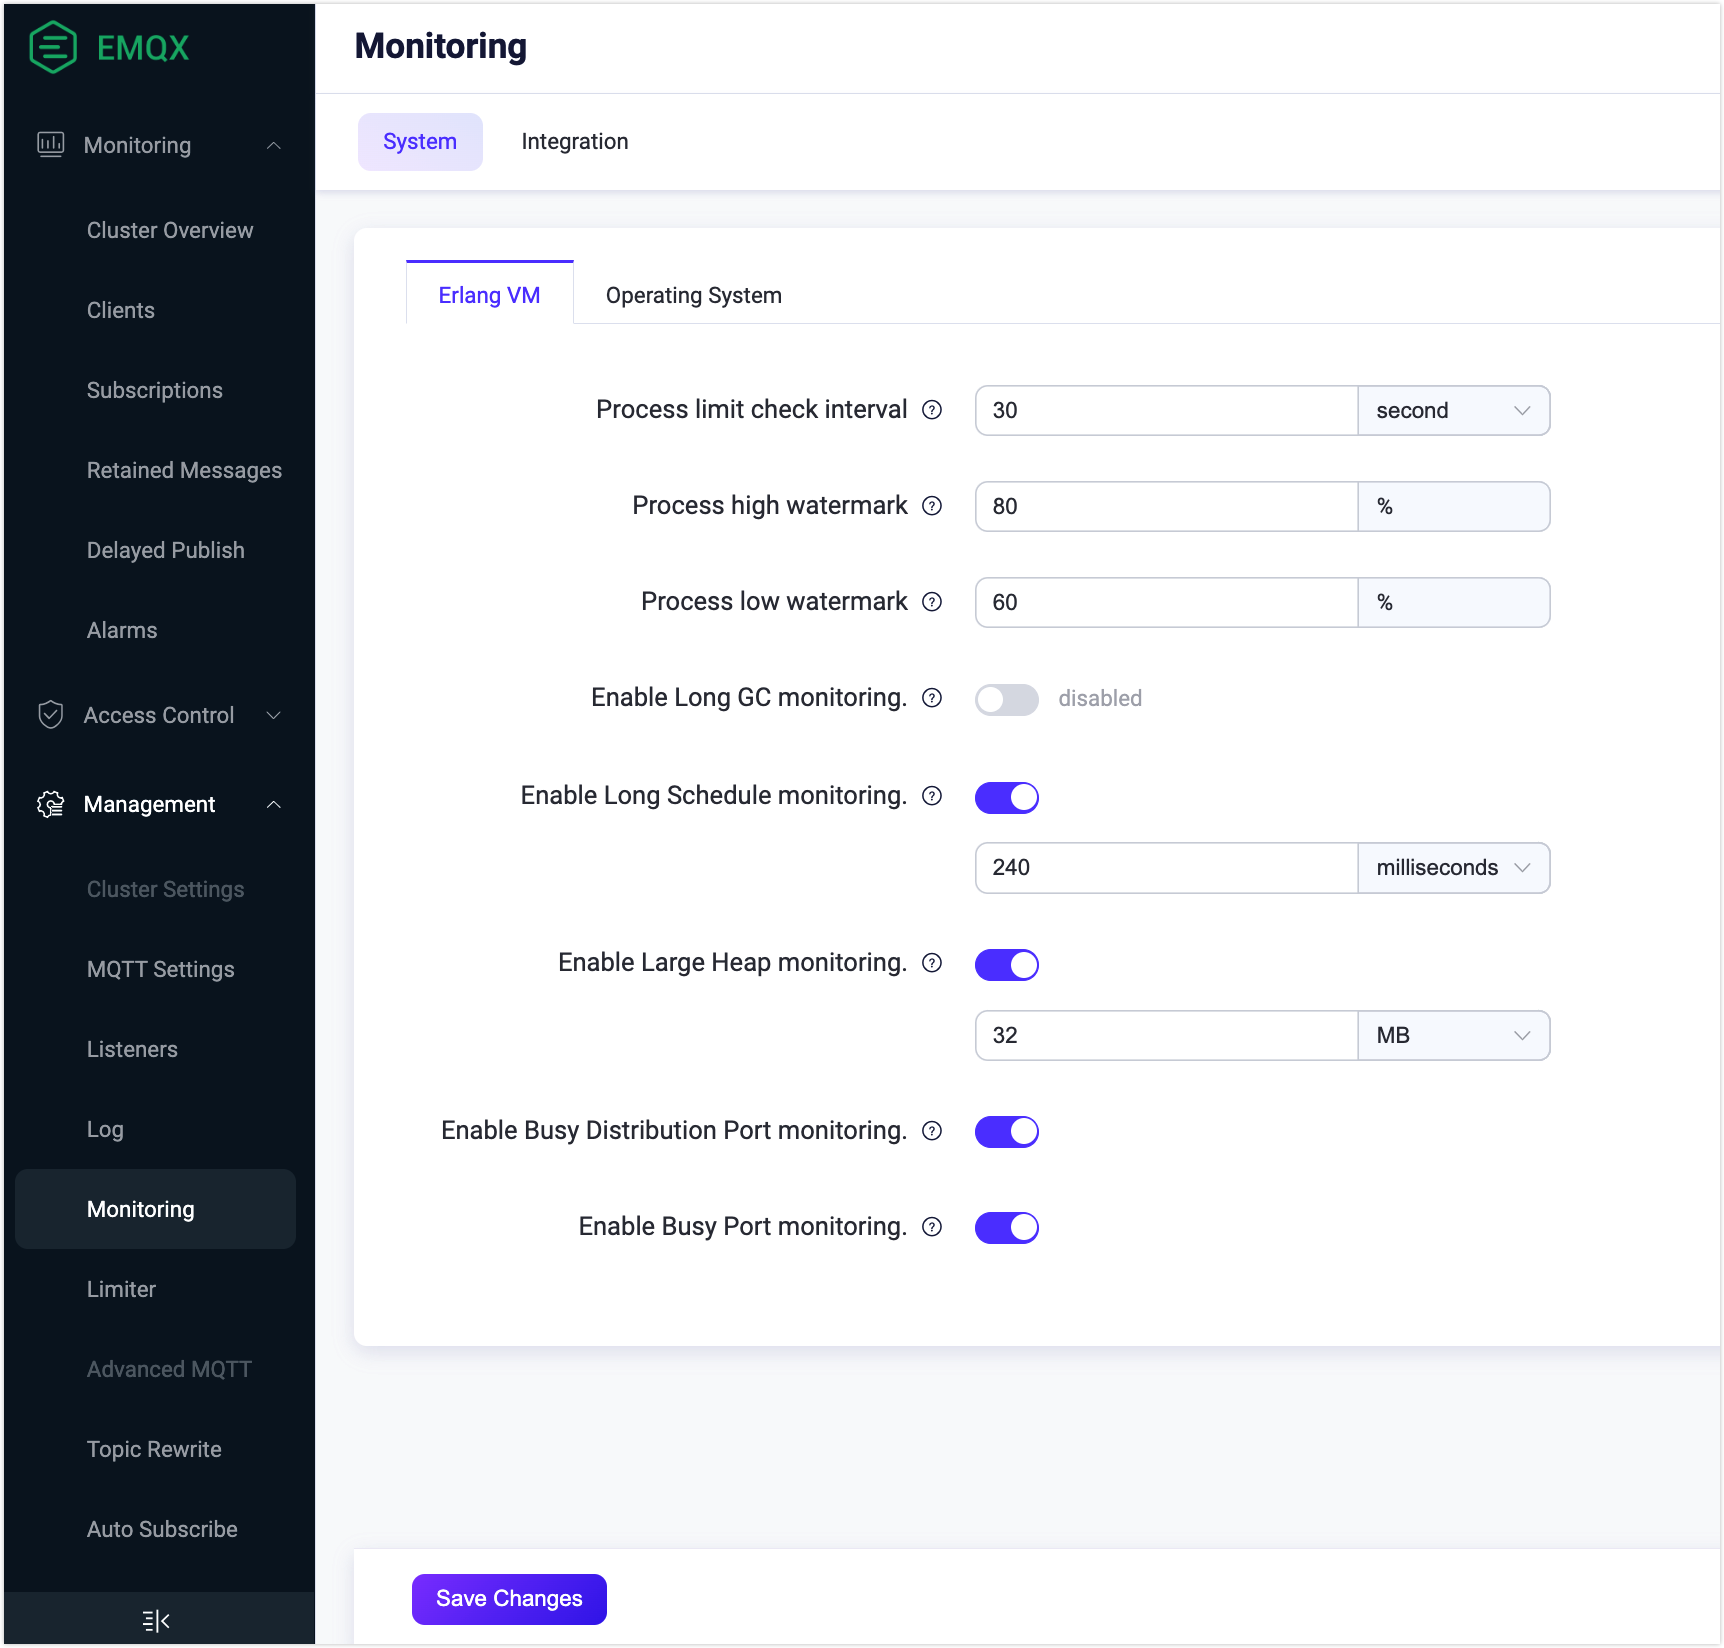
Process limit check interval: Specify the time interval for checking the periodic process limit. The default value is
30seconds.Process high watermark: Specify the threshold value of processes that can simultaneously exist at the local node. When the percentage exceeds the specified number, an alarm is raised. The default value is
80percent.Process low watermark: Specify the threshold value of processes that can simultaneously exist at the local node. When the percentage is lowered to the specified number, an alarm is cleared. The default value is
60percent.Enable Long GC monitoring: Disabled by default. When enabled, a warning-level log
long_gcis emitted and an MQTT message is published to the system topic$SYS/sysmon/long_gcwhen an Erlang process spends long time performing garbage collection.Enable Long Schedule monitoring: Enabled by default, which means when the Erlang VM detects a task scheduled for too long, a warning level log
long_scheduleis emitted. You can set the proper time scheduled for a task in the text box. The default value is240milliseconds.Enable Large Heap monitoring: Enabled by default, which means when an Erlang process consumed a large amount of memory for its heap space, a warning level log
large_heapis emitted, and an MQTT message is published to the system topic$SYS/sysmon/large_heap. You can set the limit of space bytesize in the text box. The default value is32MB.Enable Busy Distribution Port monitoring: Enabled by default, which means when the Remote Procedure Call (RPC) connection used to communicate with other nodes in the cluster is overloaded, a warning level log
busy_dis_portlog is emitted, and an MQTT message is published to system topic$SYS/sysmon/busy_dist_port.Enable Busy Port monitory: Enabled by default, which means when a port is overloaded, a warning level log
busy_portis emitted, and an MQTT message is published to the system topic$SYS/sysmon/busy_port.
After you complete the configurations, click Save Changes.
Click the Operating System tab, you can configure the following items for the system performance:
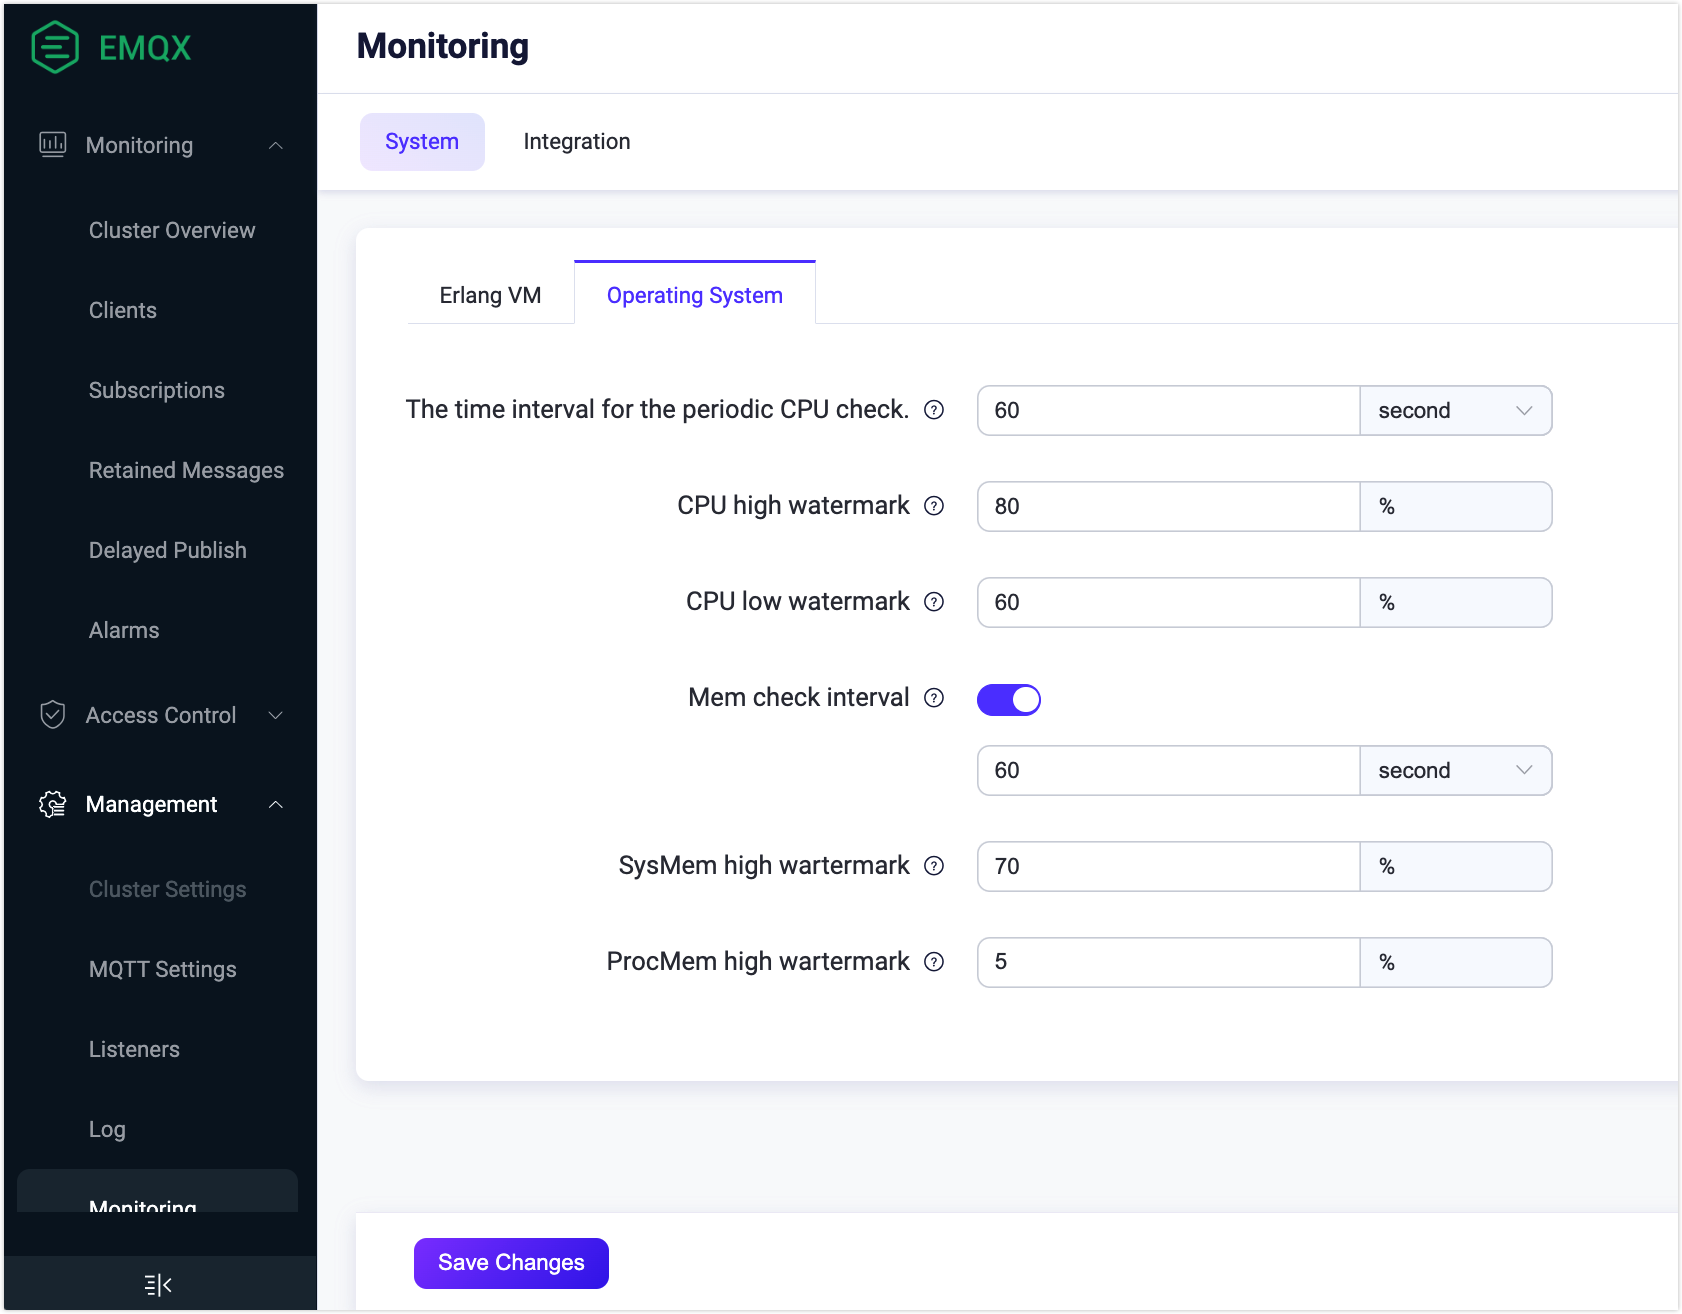
The time interval of the periodic CPU check: Specify the time interval for checking the CPU usage. The default value is
60seconds.CPU high watermark: Specify the threshold value of how much system CPU can be used. When the percentage exceeds the specified value, a corresponding alarm is raised. The default value is
80percent.CPU low watermark: Specify the threshold value of how much system CPU can be used. When the percentage is lowered to the specified value, a corresponding alarm is released. The default value is
60percent.Mem check interval: Enabled by default. You can specify the time interval for periodic memory checks. The default value is
60seconds.SysMem high watermark: Specify the threshold for how much system memory can be allocated. When the percentage exceeds the specified value, a corresponding alarm is raised. The default value is
70%.ProcMem high watermark: Specify the threshold for how much system memory can be allocated by one Erlang process. When the percentage exceeds the specified value, a corresponding alarm is raised. The default value is
5%.
After you complete the configurations, click Save Changes.
Configure Alarm Thresholds via Configuration Items
You can also configure alarm thresholds by modifying the configuration items for alarm thresholds. The following configuration items are currently available to be modified in emqx.conf file:
| Configuration Item | Description | Default Value |
|---|---|---|
| sysmon.os.cpu_check_interval | Check interval for CPU usage. | 60s |
| sysmon.os.cpu_high_watermark | The high watermark of the CPU usage, the threshold to activate the alarm. | 80% |
| sysmon.os.cpu_low_watermark | The low watermark of the CPU usage, the threshold to deactivate the alarm. | 60% |
| sysmon.os.mem_check_interval | Check interval for memory usage. | 60s |
| sysmon.os.sysmem_high_watermark | The high watermark of the system memory usage. The alarm will be activated when the total memory occupied reaches this value. | 70% |
| sysmon.os.procmem_high_watermark | The high watermark of the process memory usage. The alarm will be activated when the memory occupied by a single process reaches this value. | 5% |
| sysmonn.vm.process_check_interval | Check interval for the number of processes. | 30s |
| sysmon.vm.process_high_watermark | The high watermark of the process occupancy rate; The alarm will be activated when this threshold is reached; Measured as a ratio of the number of created processes/maximum number limit. | 80% |
| sysmon.vm.process_low_watermark | The low water mark of the process occupancy rate; The alarm will be deactivated when it goes below this threshold; Measured as a ratio of the number of created processes/maximum number limit. | 60% |
| sysmonn.vm.long_gc | Whether to enable Long GC monitoring | disabled |
| sysmon.vm.long_schedule | Whether to enable Long Schedule monitoring | disabled |
| sysmon.vm.large_heap | Whether to enable Large Heap monitoring | disabled |
| sysmon.vm.busy_port | Whether to enable Busy Distribution Port monitoring | true |
| sysmonn.top.num_items | Number of top processes per monitoring group | 10 |
| sysmon.top.sample_interlval | Check interval for top processes | 2s |
| sysmon.top.max_procs | Stop collecting data when the number of processes in the VM exceeds this value | 1000000 |