Integrate OpenTelemetry for Log Management
Like file log, OpenTelemetry logs are used to record critical events, status information, and error messages, aiding developers and operations teams in understanding an application's behavior and troubleshooting. However, OpenTelemetry logs differ in that they employ a standardized logging format, making logs easier to parse, analyze, and process. Additionally, OpenTelemetry logs support the addition of rich contextual information to records, such as Trace IDs, tags, attributes, and more.
This page provides a comprehensive guide on integrating the OpenTelemetry log handler with EMQX for advanced log management. It covers setting up the OpenTelemetry Collector, configuring the OpenTelemetry log handler in EMQX to export logs, and managing potential log overloads. This integration allows you to format EMQX log events according to OpenTelemetry log data model and export them to the configured OpenTelemetry Collector or backend system, offering improved monitoring and debugging capabilities.
Set Up OpenTelemetry Collector
Before enabling EMQX OpenTelemetry logging, you need to deploy and configure OpenTelemetry Collector and an OpenTelemetry compatible logging collection system. This guide walks you through deploying the OpenTelemetry Collector and setting it up to redirect logs to stdout using the debug exporter.
Create the OpenTelemetry Collector configuration file named
otel-logs-collector-config.yaml:yamlreceivers: otlp: protocols: grpc: exporters: logging: verbosity: detailed processors: batch: extensions: health_check: service: extensions: [health_check] pipelines: logs: receivers: [otlp] processors: [batch] exporters: [logging]In the same directory, create a Docker Compose file
docker-compose-otel-logs.yaml:yamlversion: '3.9' services: # Collector otel-collector: image: otel/opentelemetry-collector:0.90.0 restart: always command: ["--config=/etc/otel-collector-config.yaml", "${OTELCOL_ARGS}"] volumes: - ./otel-logs-collector-config.yaml:/etc/otel-collector-config.yaml ports: - "13133:13133" # Health check extension - "4317:4317" # OTLP gRPC receiverLaunch the Collector using Docker Compose:
bashdocker compose -f docker-compose-otel-logs.yaml upOnce operational, the OpenTelemetry Collector should be accessible at http://localhost:4317.
Enable OpenTelemetry Log Handler in EMQX
Add the configuration below to the EMQX
cluster.hoconfile (assuming EMQX runs locally):bashopentelemetry { exporter {endpoint = "http://localhost:4317"} logs {enable = true, level = warning} }You can also go to Management -> Monitoring in Dashboard to configure OpenTelemetry log integration under the Integration tab on the page.
Note
The
opentelemetry.logs.levelsetting is overridden by the default log level configured in EMQX log handler(s). For instance, if OpenTelemetry log level isinfobut EMQX console log level iserror, onlyerrorlevel events or higher will be exported.Start the EMQX node.
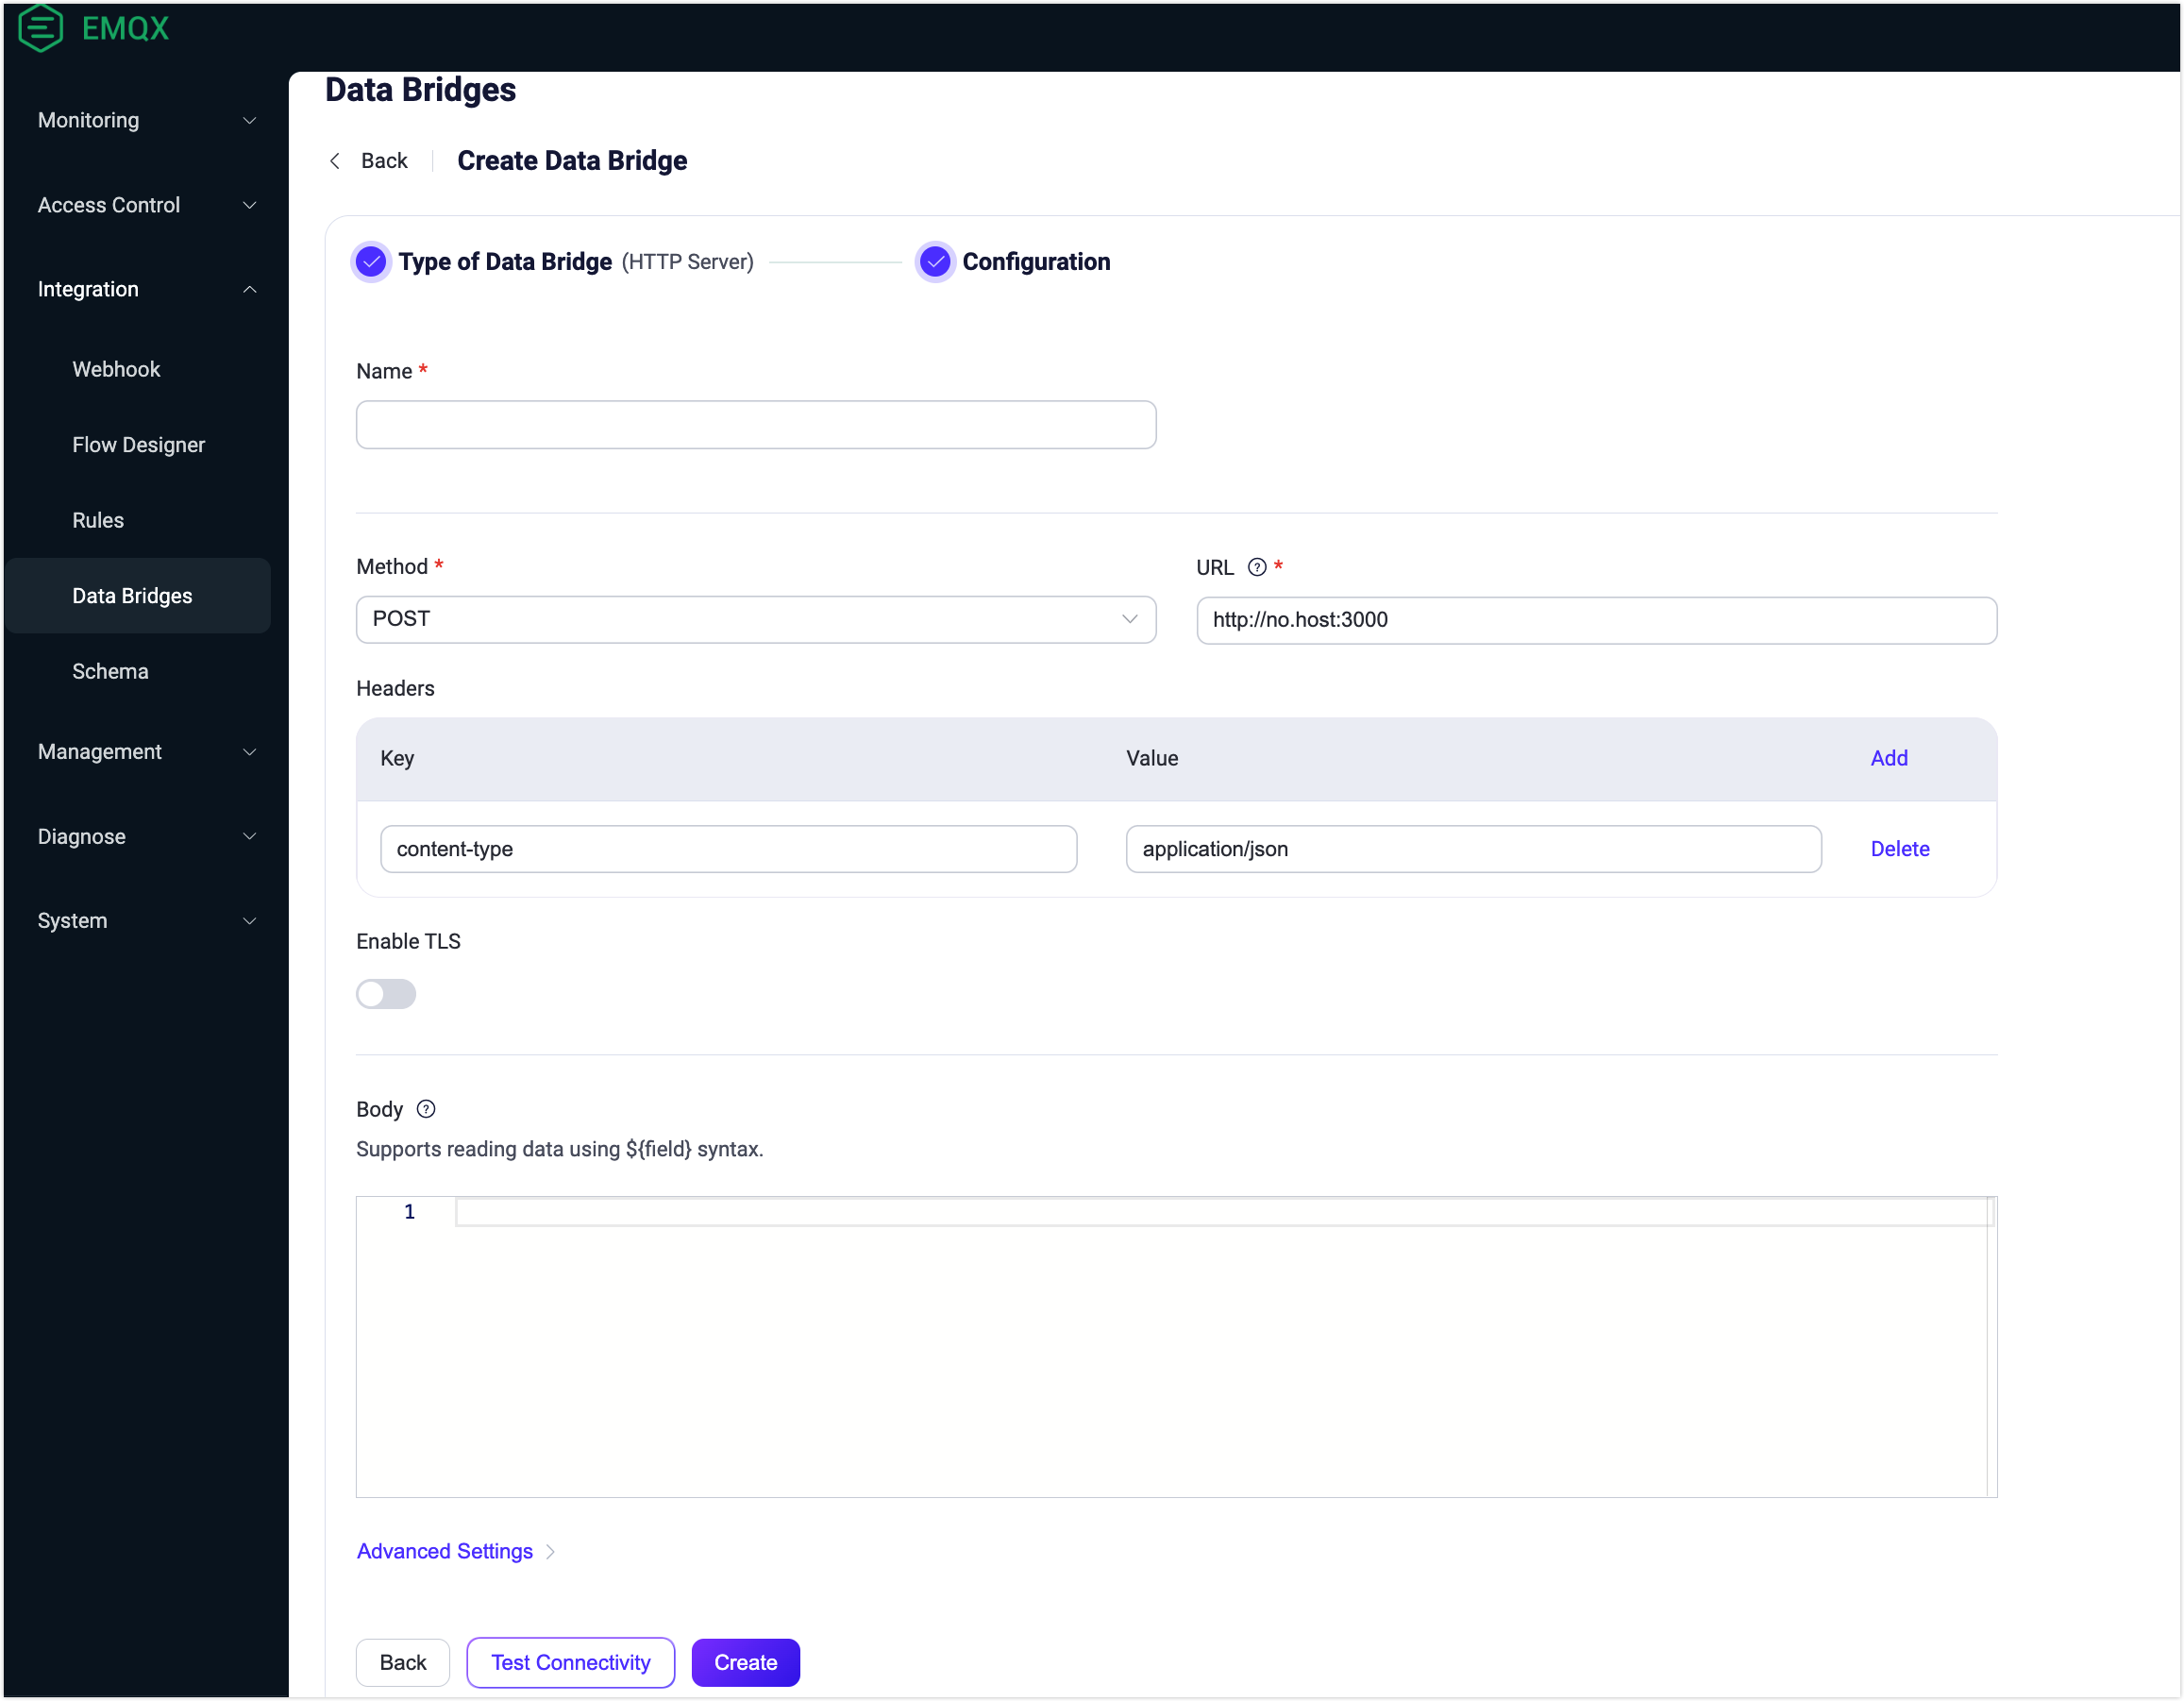
Generate EMQX log events, such as creating a bridge to an inaccessible HTTP service via the Dashboard:
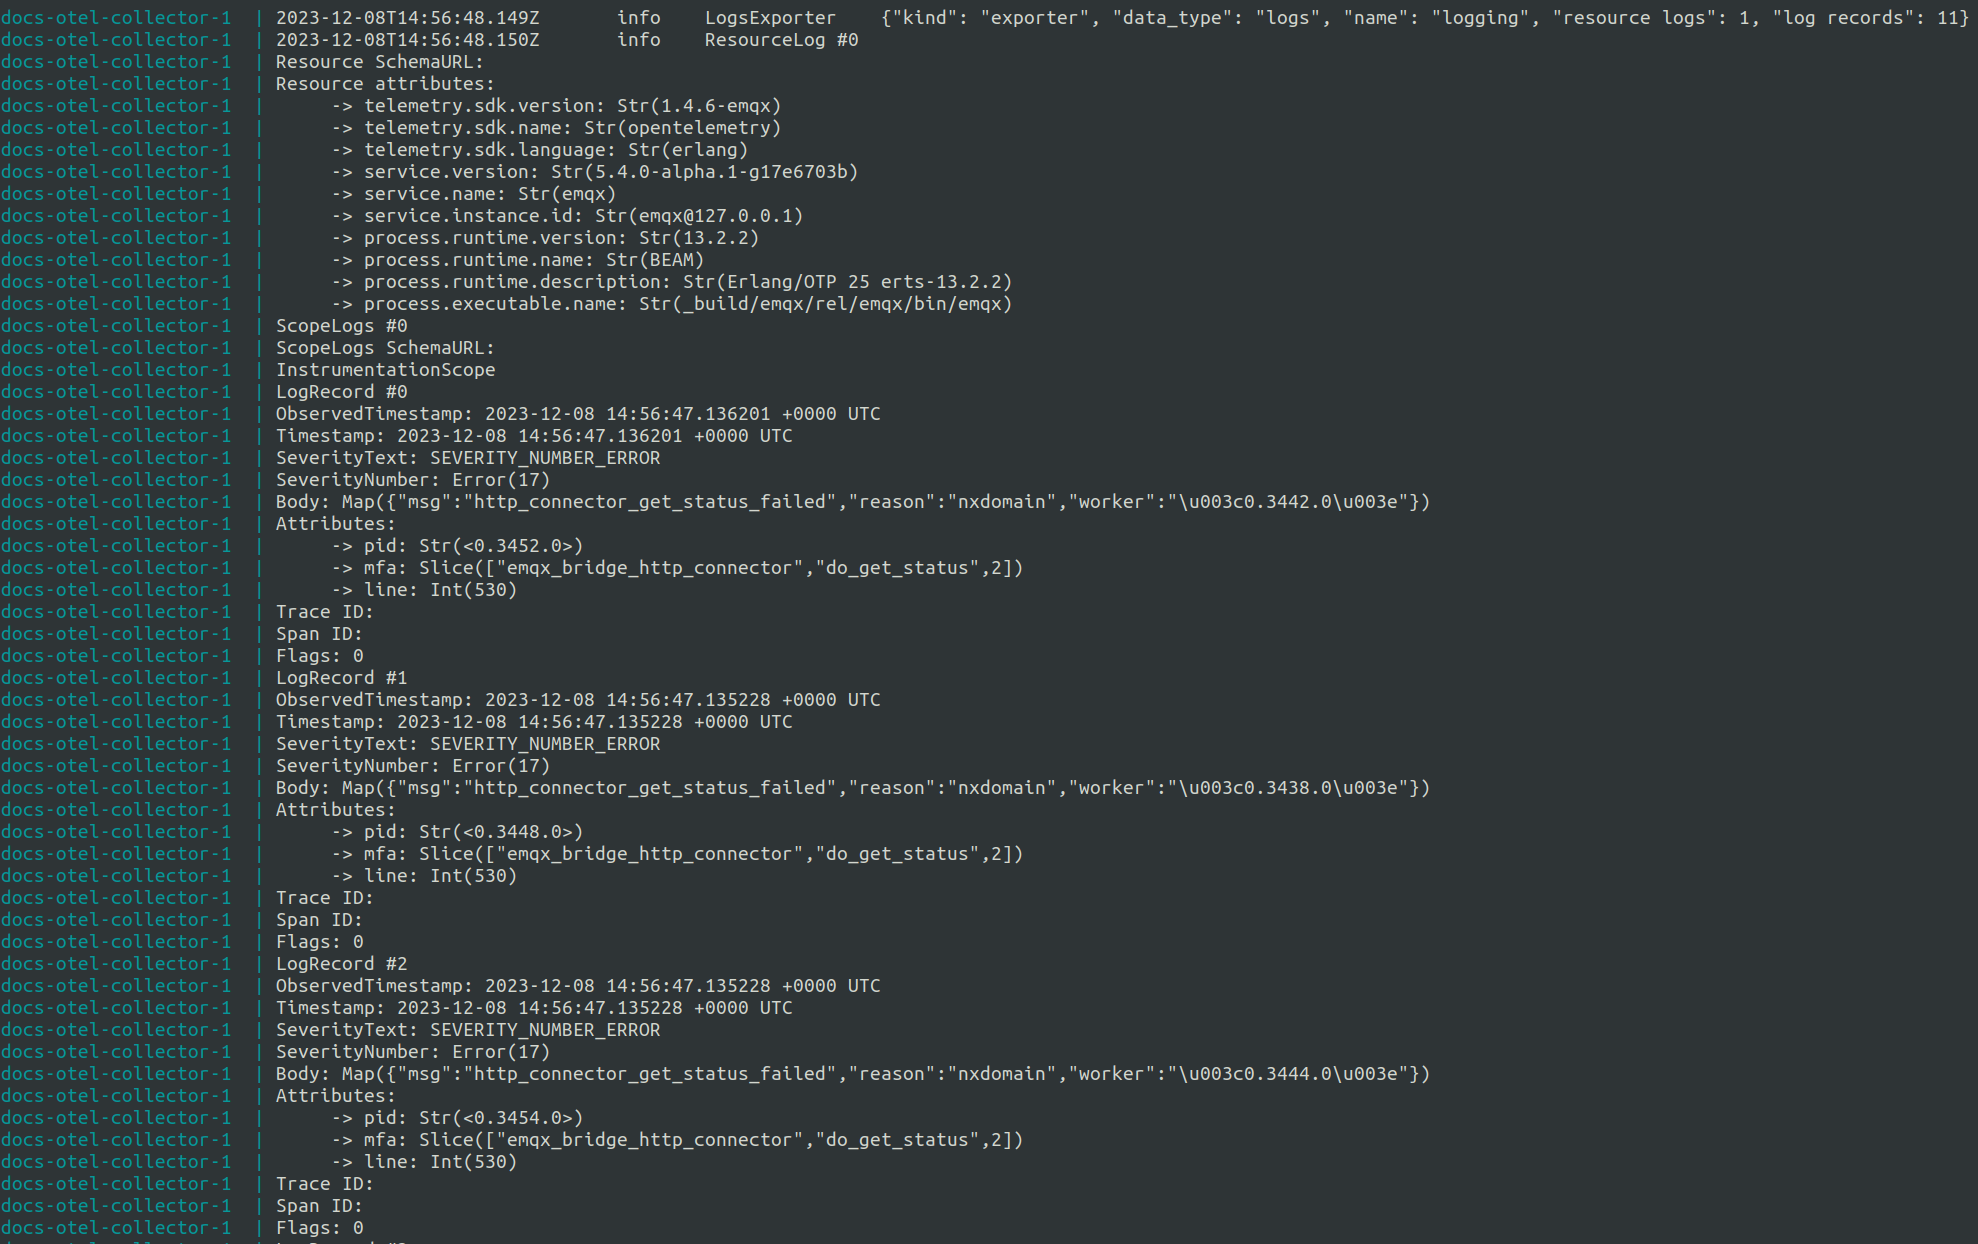
Shortly after (default is around 1 second), the Otel Collector should display the received EMQX log events, like those indicating HTTP bridge connection failures:
Manage Log Overload
EMQX accumulates log events and exports them periodically in batches. The frequency of this export is controlled by the opentelemetry.logs.scheduled_delay parameter, defaulting to 1 second. The batching log handler incorporates an overload protection mechanism, allowing accumulating events only up to a specific limit, which defaults to 2048. You can configure this limit using the following configuration:
opentelemetry {
  logs { max_queue_size = 2048 }
}
Once the max_queue_size limit is reached, new log events will be dropped until the current queue is exported.
Note
OpenTelemetry logs overload protection works independently from the default EMQX log handler(s) overload protection. Thus, depending on the configuration, the same log event can be dropped by OpenTelemetry handler but logged by default EMQX log handler(s), or vice versa.