Integrate OpenTelemetry Tracing
OpenTelemetry tracing is a specification for tracing the flow of requests in a distributed system, allowing you to trace how requests flow through a distributed system and providing the ability to visualize and analyze the performance and behavior of requests. In the MQTT scenario, this concept can be used to trace requests across different participants in MQTT message transmission (Publisher - MQTT server - Subscriber).
"Trace context" is a mechanism used in distributed tracing to track and identify requests or transactions that span multiple systems and services. In the W3C Trace Context MQTT document, this concept is applied to the MQTT protocol to enable tracking of requests across different participants in MQTT message transmission. This allows system administrators or developers to understand how messages flow through the system.
EMQX's inherent ability to propagate trace context enables it to seamlessly participate in distributed tracing systems. This propagation is achieved simply by forwarding the traceparent and tracestate user properties from the message publisher to the subscriber. When EMQX forwards an application message to a client, it ensures the integrity of the trace context is maintained and transmitted unchanged. This method is fully compliant with MQTT specification 3.3.2.3.7, ensuring consistency and reliability in trace data transmission.
Note
User-Property was introduced in MQTT 5.0, so EMQX can extract and propagate Trace Context only when MQTT 5.0 is used.
For non-MQTT 5.0 clients, it is necessary to enable the Traces All Messages option in EMQX. EMQX will automatically add a trace ID to messages for internal distributed tracing.
With OpenTelemetry distributed tracing, EMQX system administrators or developers can monitor and analyze the performance and behavior of IoT applications in real-time. It allows for quick detection and resolution of issues when they occur.
This page introduces how to integrate OpenTelemetry tracing with EMQX, detailing the setup of the OpenTelemetry Collector and the enabling and configuring of OpenTelemetry trace integration in EMQX, as well as managing tracing span overload.
Set Up OpenTelemetry Collector
Before integrating EMQX with OpenTelemetry traces, you need to deploy and configure OpenTelemetry Collector and preferably an OpenTelemetry-compatible observability platform, for example, Jaeger. The following steps outline the deployment and configuration process:
Create the OpenTelemetry Collector configuration file,
otel-trace-collector-config.yaml:yamlreceivers: otlp: protocols: grpc: exporters: otlp: endpoint: jaeger:4317 tls: insecure: true processors: batch: extensions: health_check: service: extensions: [health_check] pipelines: traces: receivers: [otlp] processors: [batch] exporters: [otlp]In the same directory, create a Docker Compose file,
docker-compose-otel-trace.yaml:yamlversion: '3.9' services: jaeger: image: jaegertracing/all-in-one:1.51.0 restart: always ports: - "16686:16686" otel-collector: image: otel/opentelemetry-collector:0.90.0 restart: always command: ["--config=/etc/otel-collector-config.yaml", "${OTELCOL_ARGS}"] volumes: - ./otel-trace-collector-config.yaml:/etc/otel-collector-config.yaml ports: - "13133:13133" # Health check extension - "4317:4317" # OTLP gRPC receiver depends_on: - jaegerStart the services using Docker Compose:
bashdocker compose -f docker-compose-otel-trace.yaml upAfter starting, the OpenTelemetry Collector listens on the default gRPC port (4317) on the host machine and Jaeger WEB UI can be accessed at http://localhost:16686.
Enable OpenTelemetry Tracing in EMQX
This section guides you through enabling OpenTelemetry tracing in EMQX, demonstrating the distributed tracing capabilities in a multi-node setup.
Add the following configuration to the EMQX
cluster.hoconfile (assuming EMQX is running locally):bashopentelemetry { exporter { endpoint = "http://localhost:4317" } traces { enable = true # Whether to trace all messages # If a trace ID cannot be extracted from the message, a new trace ID will be generated. # filter.trace_all = true } }You can also go to Management -> Monitoring in Dashboard to configure OpenTelemetry traces integration under the Integration tab on the page.
Start the EMQX node, for example, a two-node cluster with the node names
emqx@127.0.0.1andemqx1@127.0.0.1, to demonstrate the distributed tracing capabilities.Subscribe clients to the same topics using MQTTX CLI client on different nodes and ports.
On the
emqx@127.0.0.1node (default MQTT listener on port 1883):bashmqttx sub -t t/trace/test -h localhost -p 1883On the
emqx1@127.0.0.1node (listener on port 1884):bashmqttx sub -t t/trace/test -h localhost -p 1884
Publish a message with Trace Context by sending a message to the topic including a valid
traceparentUser-Property:bashmqttx pub -t t/trace/test -h localhost -p 1883 -up "traceparent: 00-cce3a024ca134a7cb4b41e048e8d98de-cef47eaa4ebc3fae-01"After approximately 5 seconds (EMQX’s default interval for exporting trace data), navigate to the Jaeger WEB UI at http://localhost:16686 to observe trace data:
Select the
emqxservice and click Find Traces. If theemqxservice doesn't appear immediately, refresh the page after a few moments. You should see the message trace: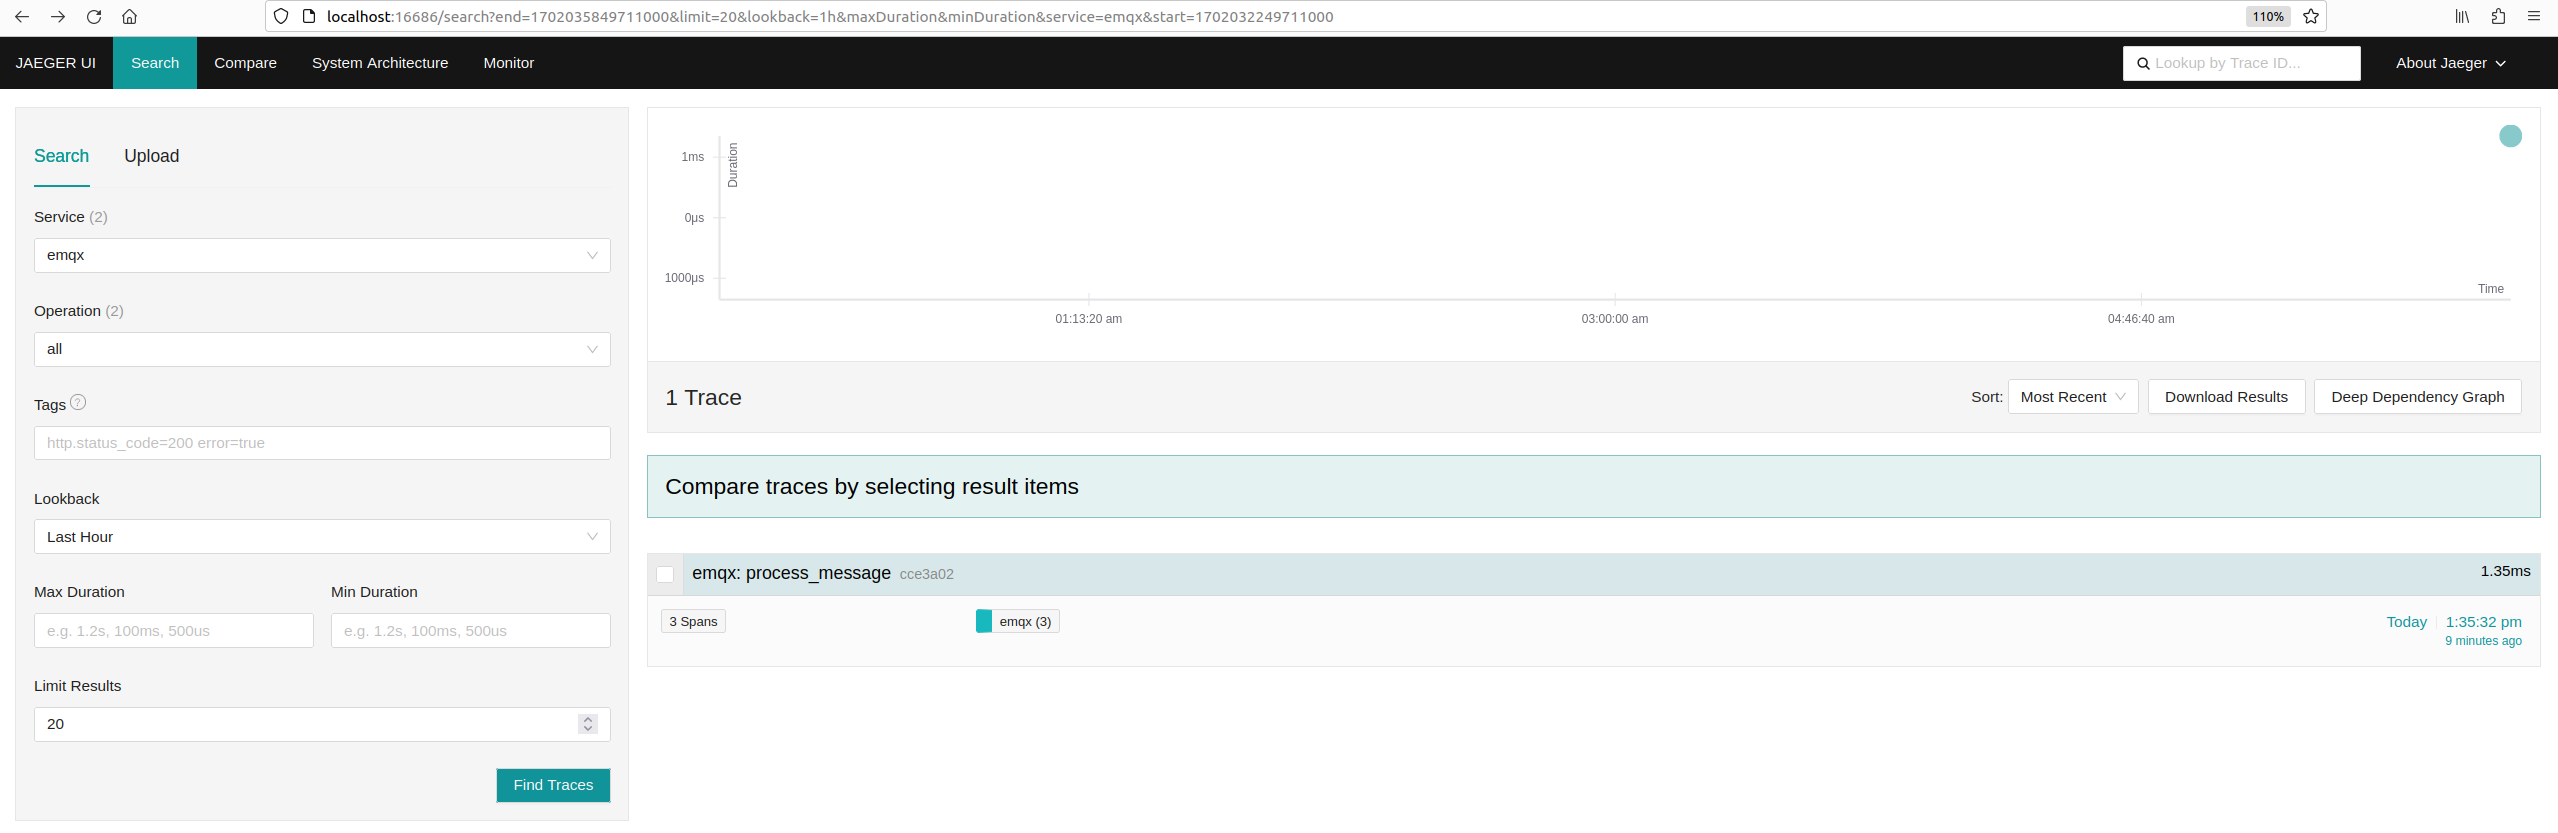
Click on a trace to view detailed span information and the trace timeline
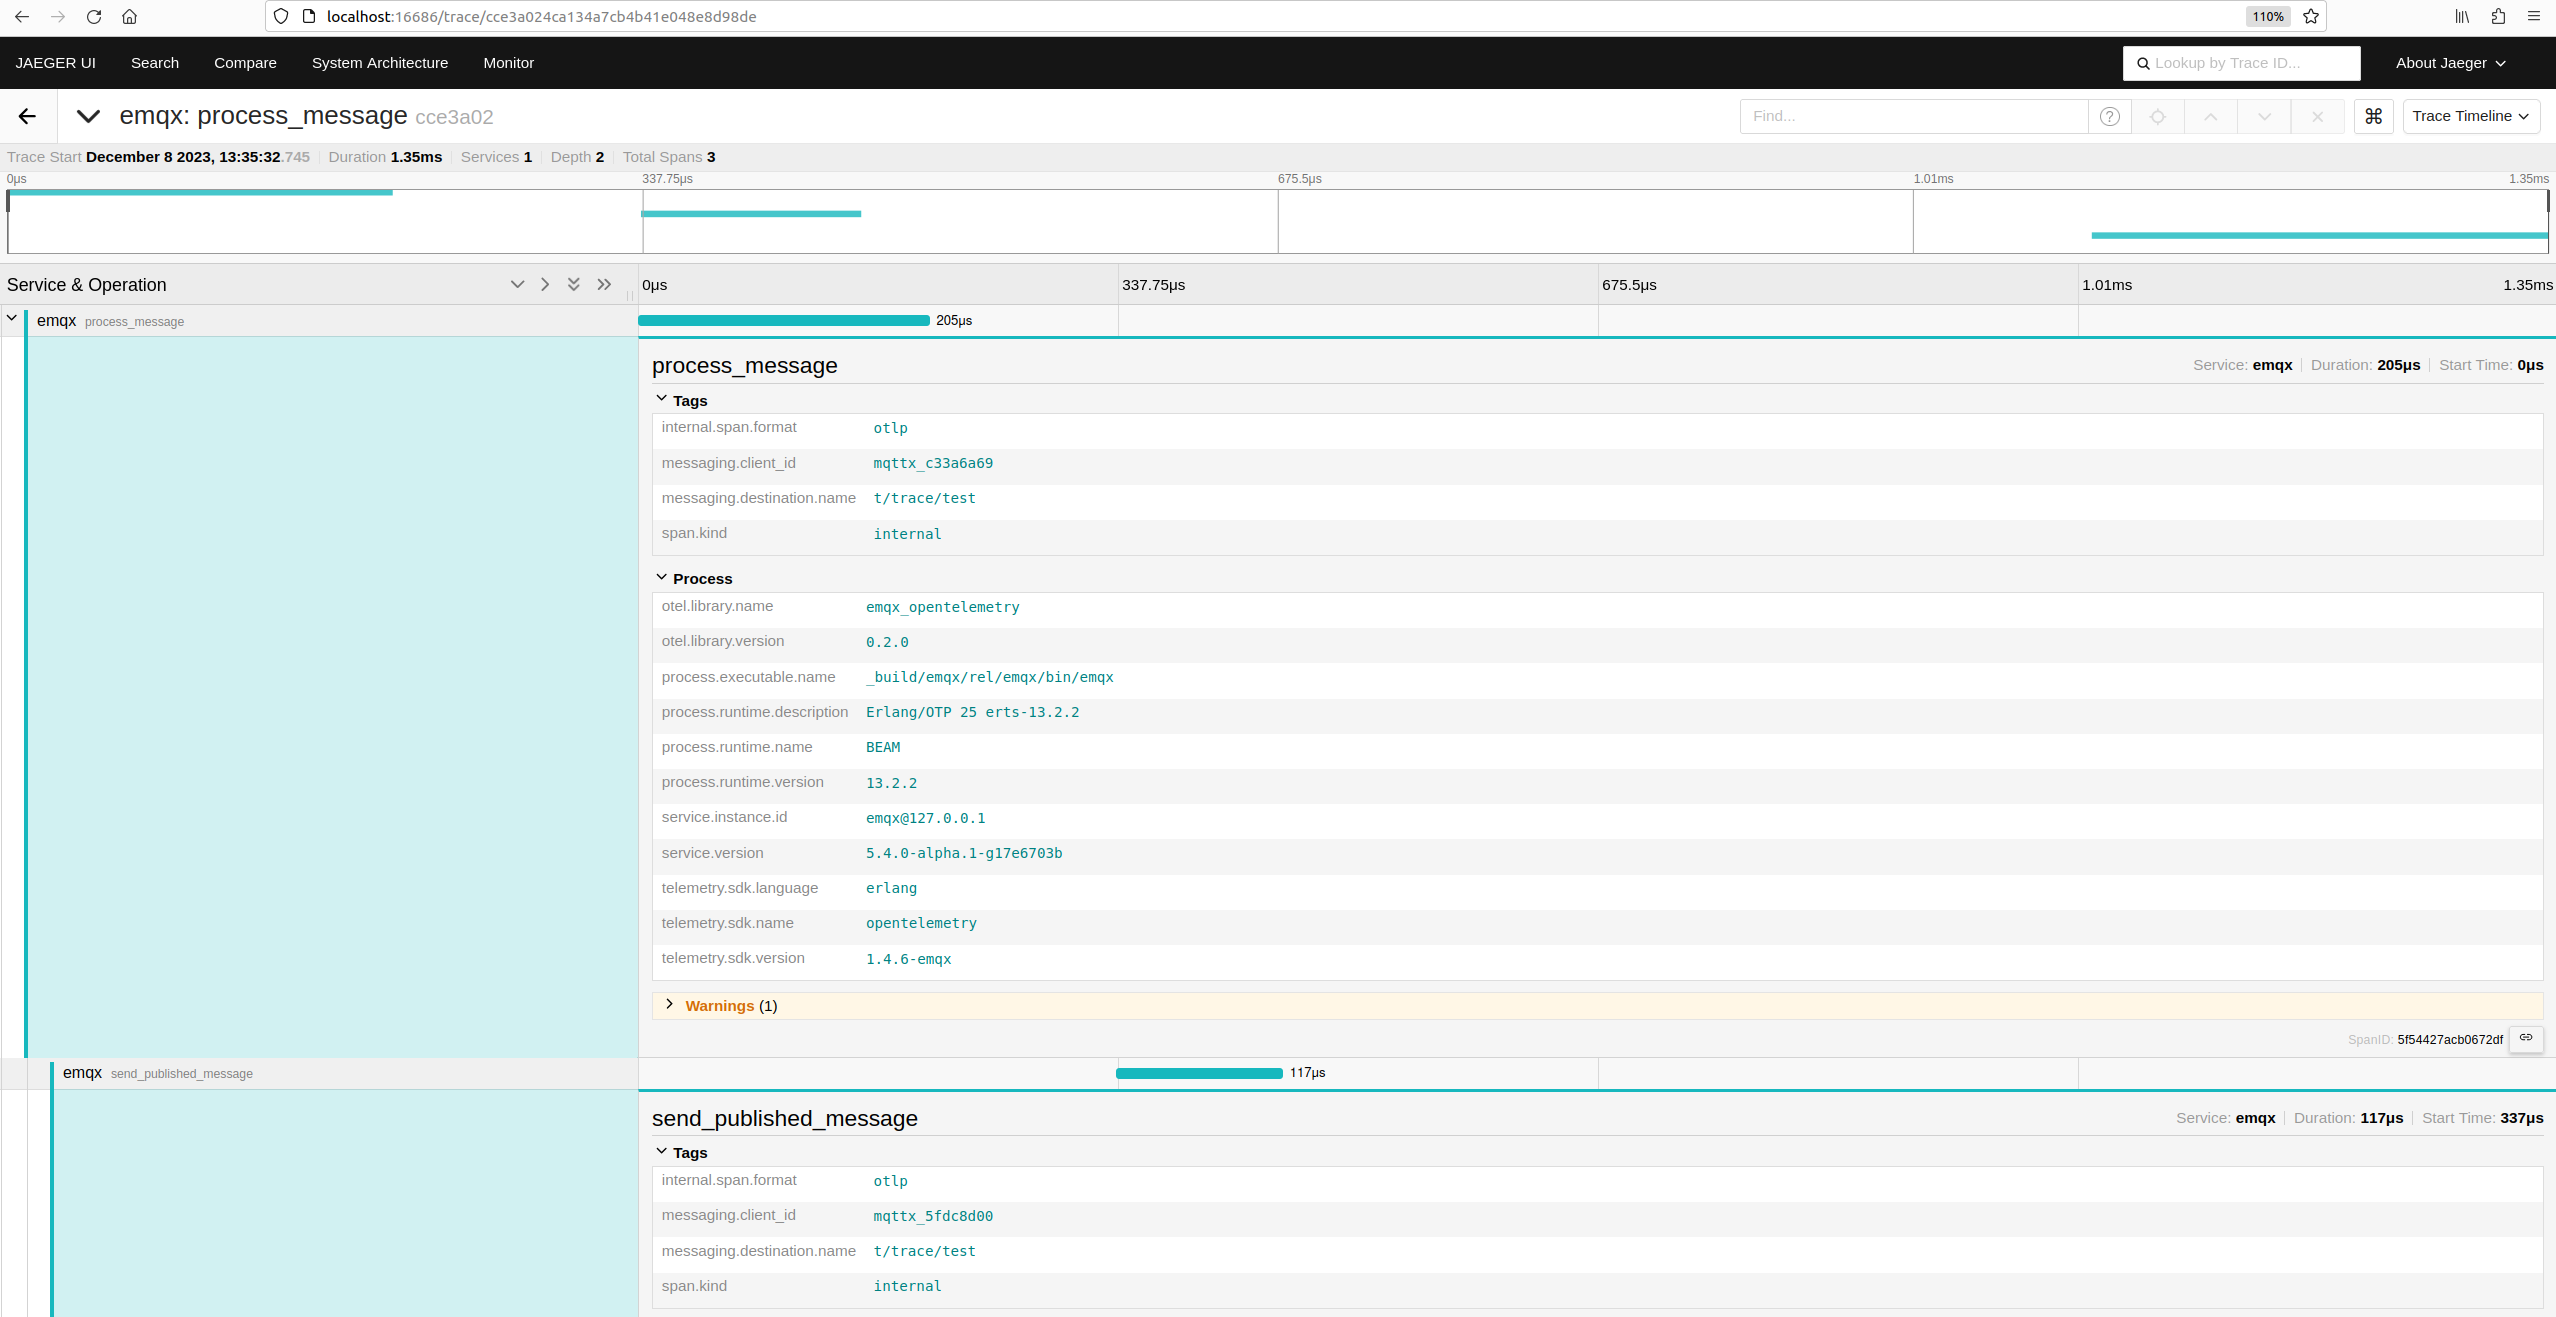
In this example, EMQX traces two distinct types of spans:
process_messagespan starts when PUBLISH packet is received and parsed by an EMQX node and ends when the message is dispatched to local subscribers and/or forwarded to other nodes that have active subscribers. Each span corresponds to one traced published message.send_published_messagespan starts when a traced message is received by a subscriber's connection control process and ends when the outgoing packet is serialized and sent to the connection socket. Each active subscriber generates onesend_published_messagespan.
Manage Tracing Span Overload
EMQX accumulates tracing spans and exports them periodically in batches. The exporting interval is controlled by the opentelemetry.trace.scheduled_delay parameter, which defaults to 5 second. The batching trace spans processor incorporates an overload protection mechanism, allowing accumulating spans only up to a certain limit, which defaults to 2048 spans. You can configure this limit using the following configuration:
opentelemetry {
  traces { max_queue_size = 2048 }
}
Once the max_queue_size limit is reached, new tracing spans will be dropped until the current queue is exported.
Note
If a traced message is dispatched to a high number of subscribers (much higher than the value of max_queue_size), it is expected that only a small number of spans will be exported and most of the spans will be dropped by the overload protection.
Increasing max_queue_size should always be done with extra care, as it can affect performance and memory consumption.