Integrate OpenTelemetry to View Metrics
EMQX has built-in support for pushing metrics directly to the OpenTelemetry Collector over the gRPC OTEL protocol. The Collector can then route, filter, and transform the data to any desired backend for storage and visualization.
This page introduces how to integrate OpenTelemetry with EMQX through the Dashboard and view EMQX metrics through Prometheus.
Prerequisites
Before integrating with OpenTelemetry, you need to deploy and configure OpenTelemetry and Prometheus.
- Deploy OpenTelemetry Collector.
- Configure Collector's gRPC receiving port (default 4317) and Prometheus metrics exporting port (8889).
# otel-collector-config.yaml
receivers:
  otlp:
    protocols:
      grpc:

exporters:
  prometheus:
    endpoint: "0.0.0.0:8889"

processors:
  batch:

service:
  pipelines:
    metrics:
      receivers: [otlp]
      processors: [batch]
exporters: [prometheus]- Deploy Prometheus.
- Configure Prometheus to scrape metrics collected by the Collector.
# prometheus.yaml
scrape_configs:
  - job_name: 'otel-collector'
    scrape_interval: 10s
    static_configs:
      - targets: ['otel-collector:8889'] # emqx metrics
      - targets: ['otel-collector:8888'] # collector metrics
Enable OpenTelemetry Metrics in EMQX
You can use EMQX Dashboard or configuration file to configure EMQX's integration with OpenTelemetry metrics feature. In the EMQX Dashboard, click Management -> Monitoring on the left navigation menu, then click the Integration tab for the configuration for Metrics.
Add the configuration below to the EMQX cluster.hocon file (assuming EMQX runs locally):
opentelemetry {
exporter { endpoint = "http://localhost:4317" }
metrics {
enable = true
interval = "10s"
}
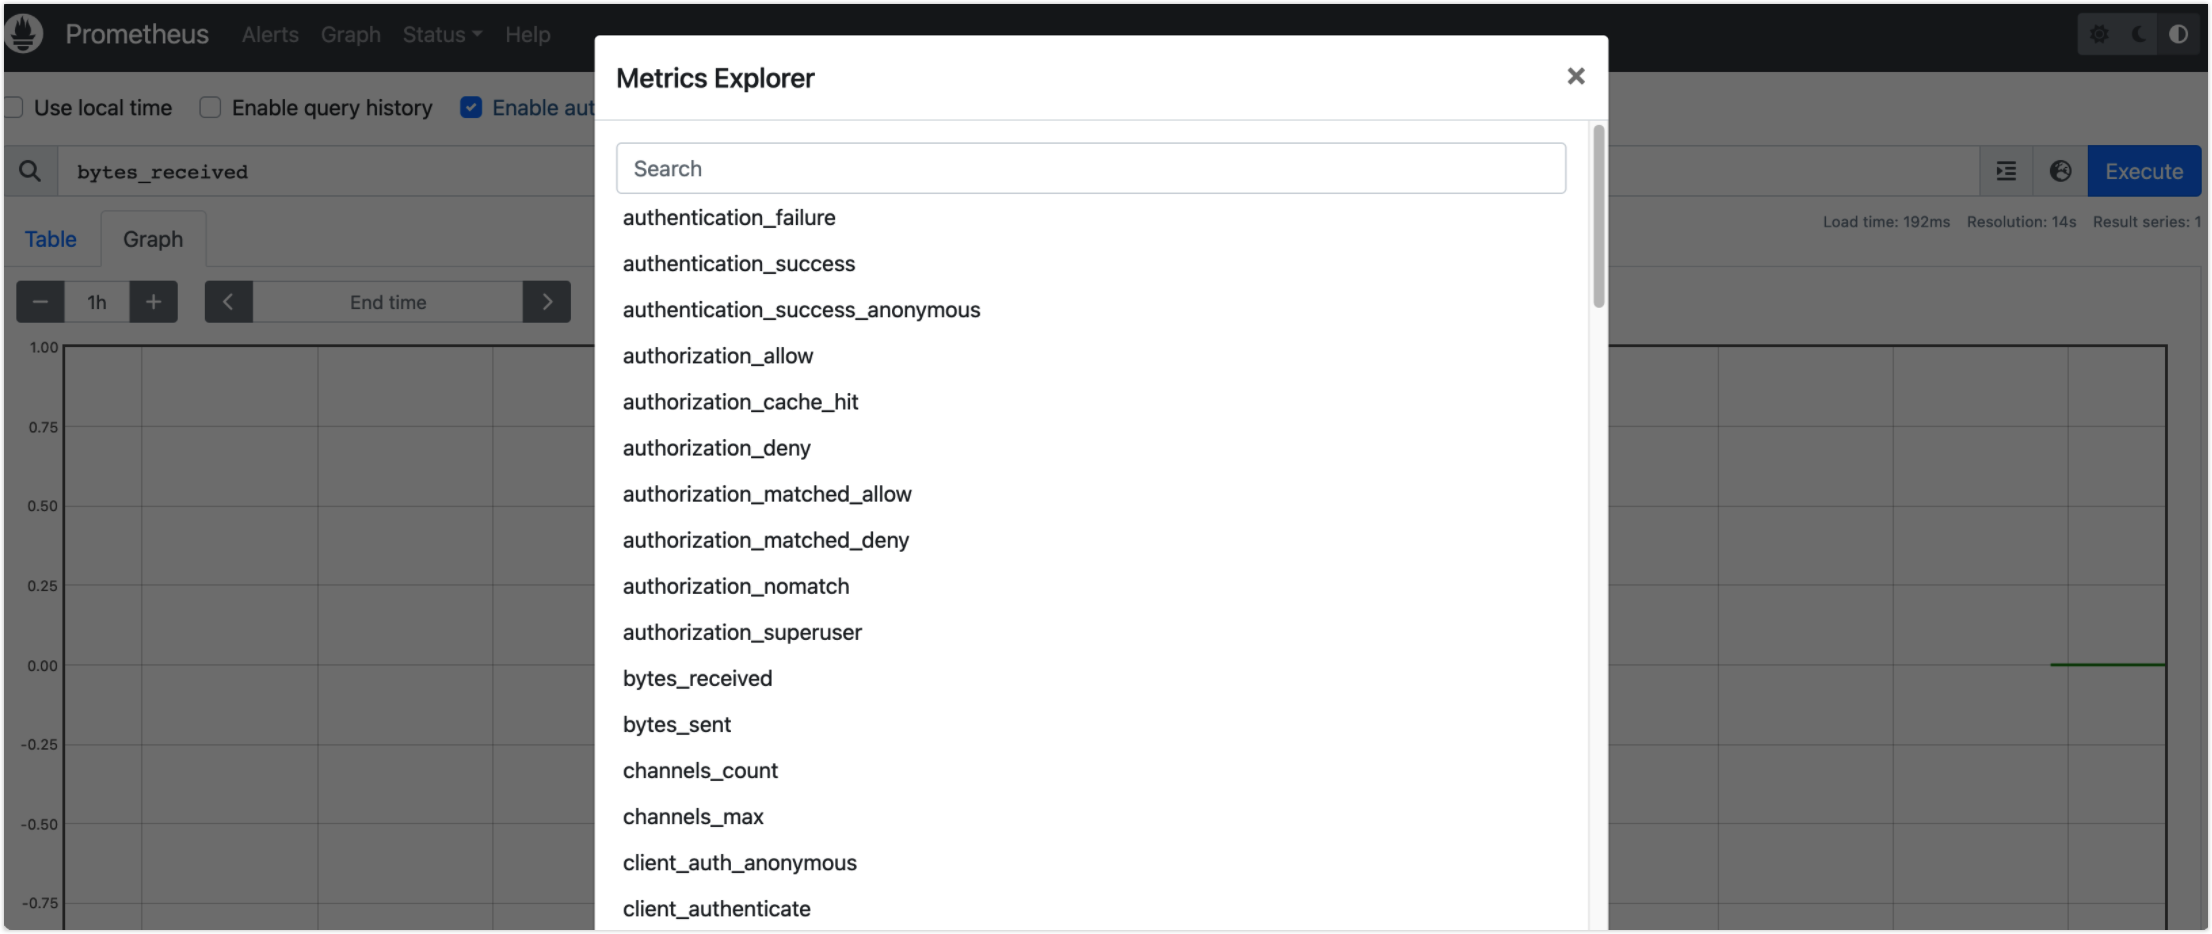
}Visualize EMQX Metrics in Prometheus
The EMQX metrics can be viewed in Prometheus web console (http://otel-collector:9090):