Topic Metrics
EMQX provides a topic monitoring feature (called Topic Metrics) that allows you to count the number of messages sent and received, the rate and other metrics for a given topic. You can view and use this feature on EMQX Dashboard by clicking Diagnose -> Topic Metrics from the left navigation menu, or you can request topic metrics through the HTTP API.
View Topic Metrics on Dashboard
After the Topic Metrics feature is enabled, you can add new topic monitoring rules by clicking the Add Topic button in the top right corner of the page. At the moment, topic filters with wildcards are currently not supported, for example, + or #. You have to use specific topic names.
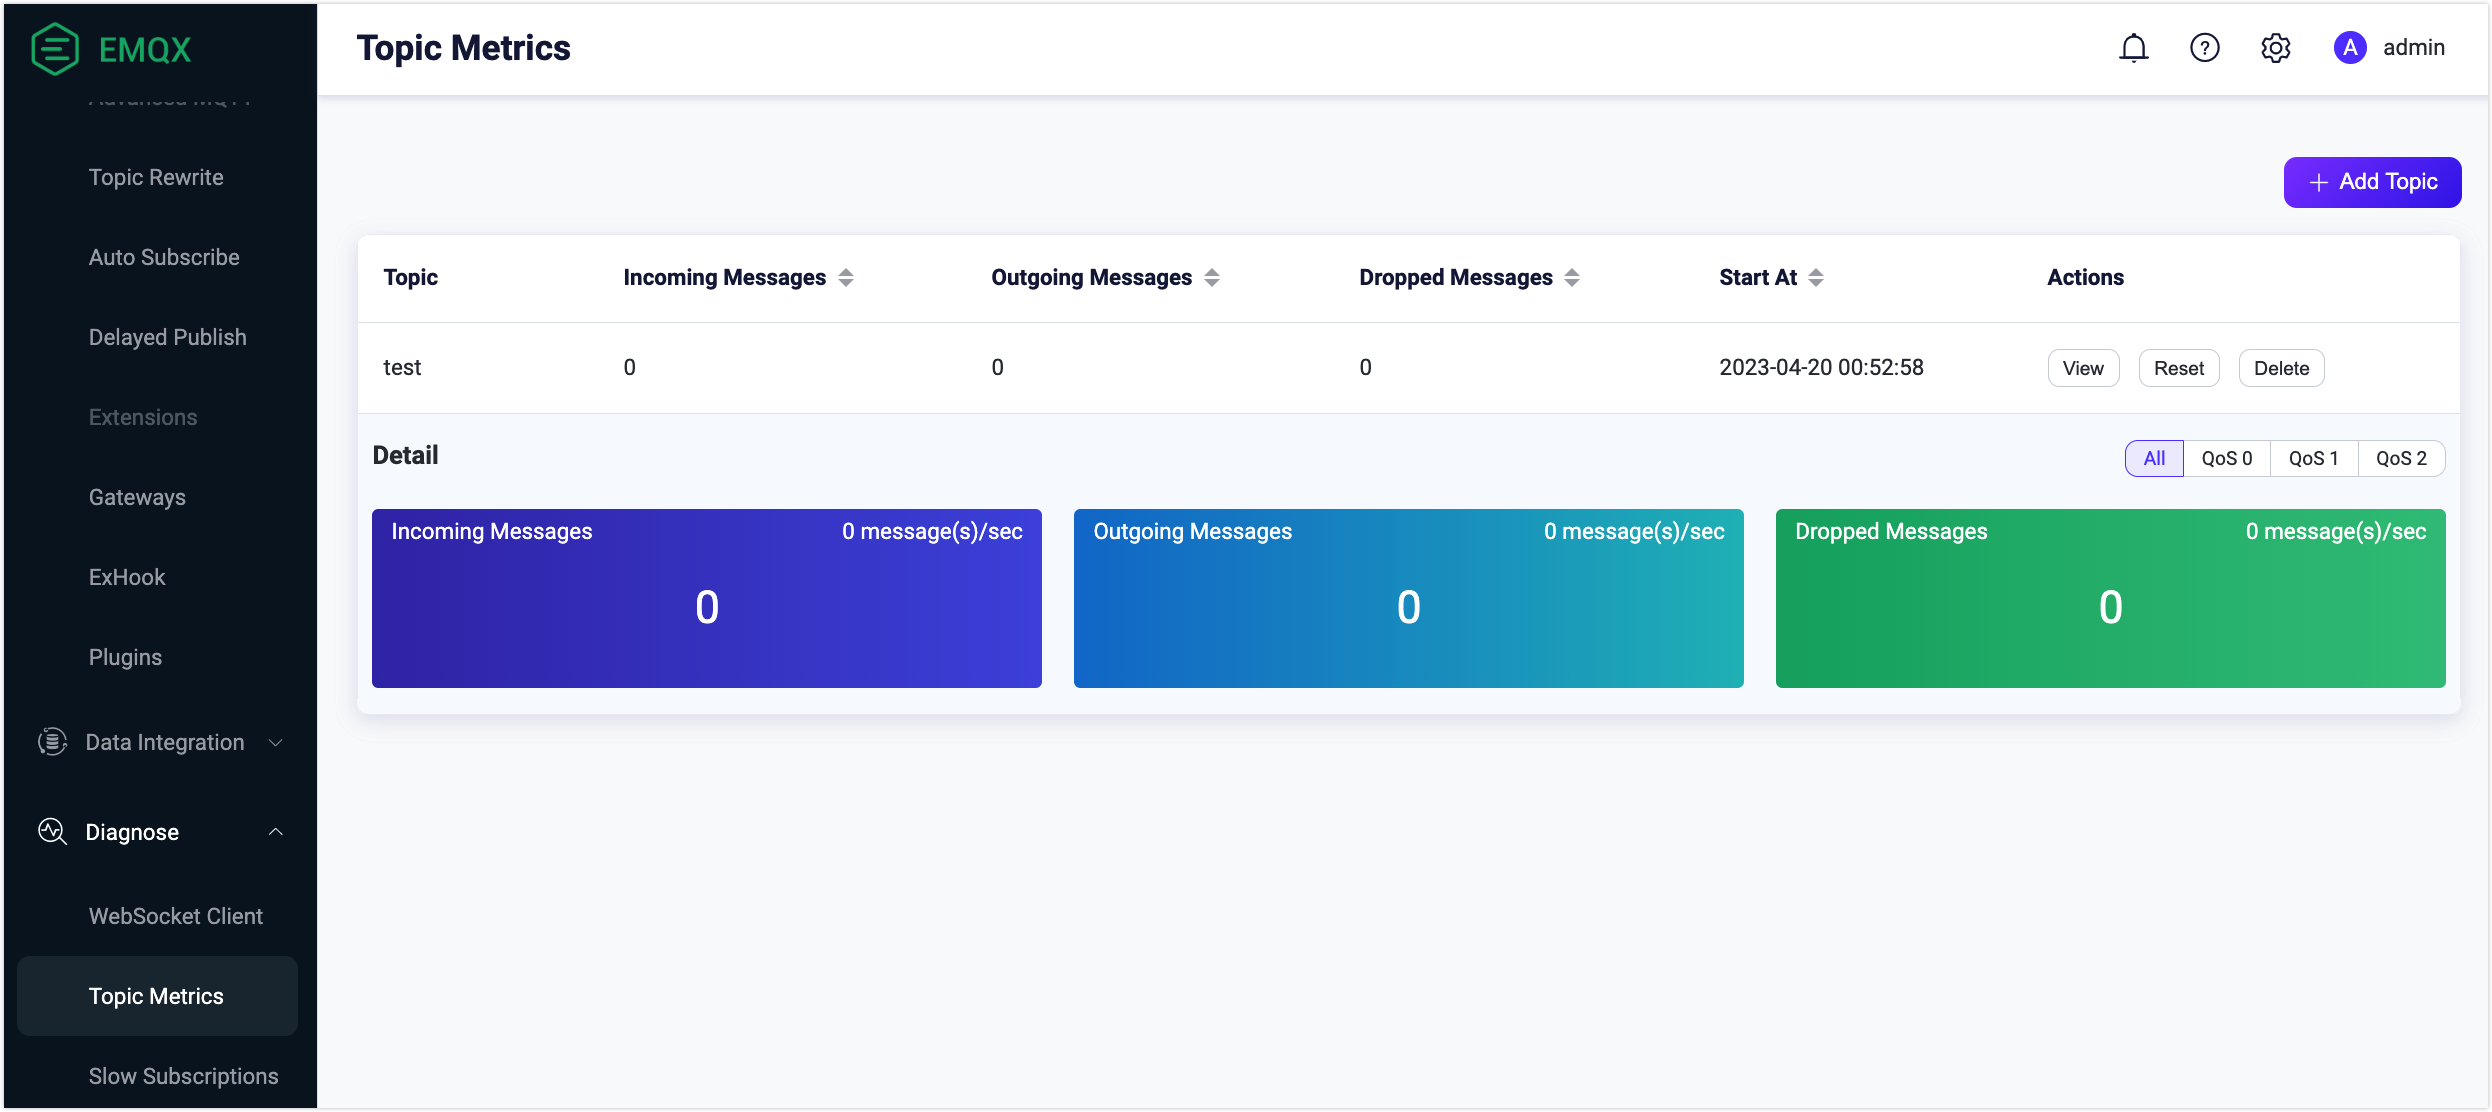
Click the View button in Actions column and you will see detailed information about how many messages on this topic are received, sent, and dropped in one second. You can select different QoS levels to view the information by QoS.
The topic metrics list contains the following fields:
- Topic: The name of the topic that you want to monitor.
- Incoming messages: The total number of message incoming on the current topic and the number of message incoming per second.
- Outgoing Messages: The total number of message outgoing on the current topic and the number of message outgoing per second.
- Dropped Messages: The total number of message dropped on the current topic and the number of message dropped per second.
- Start at: Time you created this topic monitoring record.
- Actions: Operations you can do on this topic monitoring record.
- View: View detailed metrics of the topic by different QoS levels.
- Reset: Click this button will get the monitoring restarted.
- Delete: Remove the record.
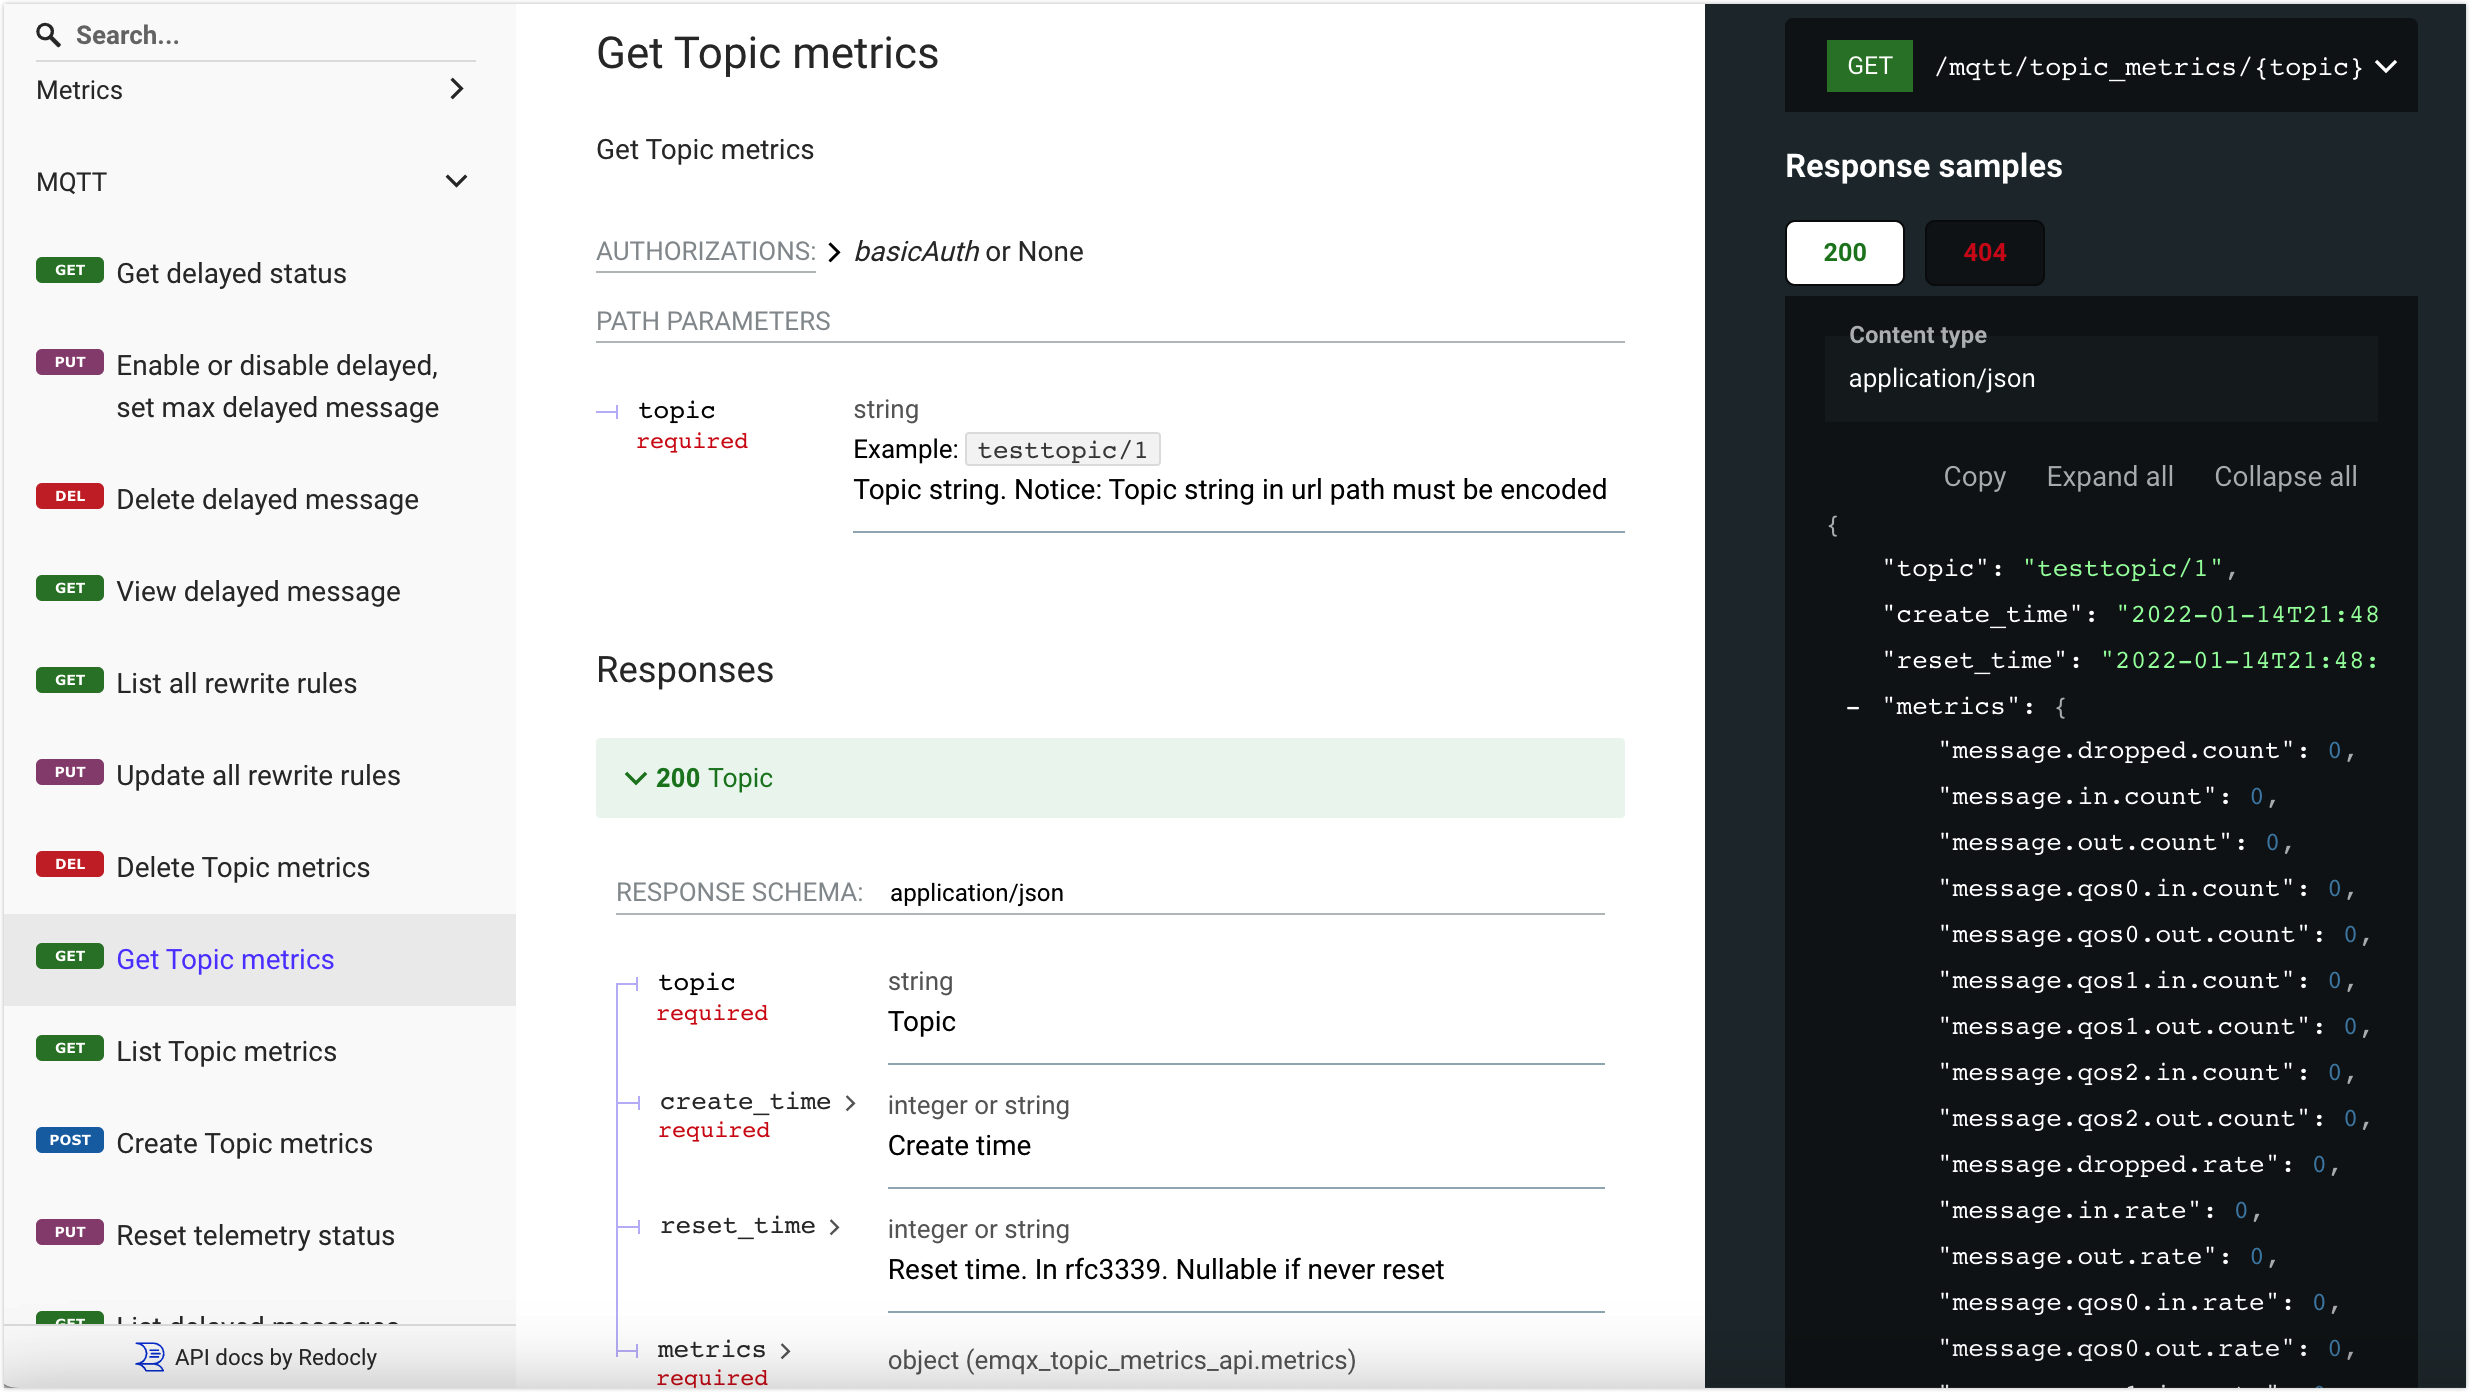
Get Topic Metrics via REST API
You can also get the topic metrics through the API. On how to work with EMQX APIS, see REST API.